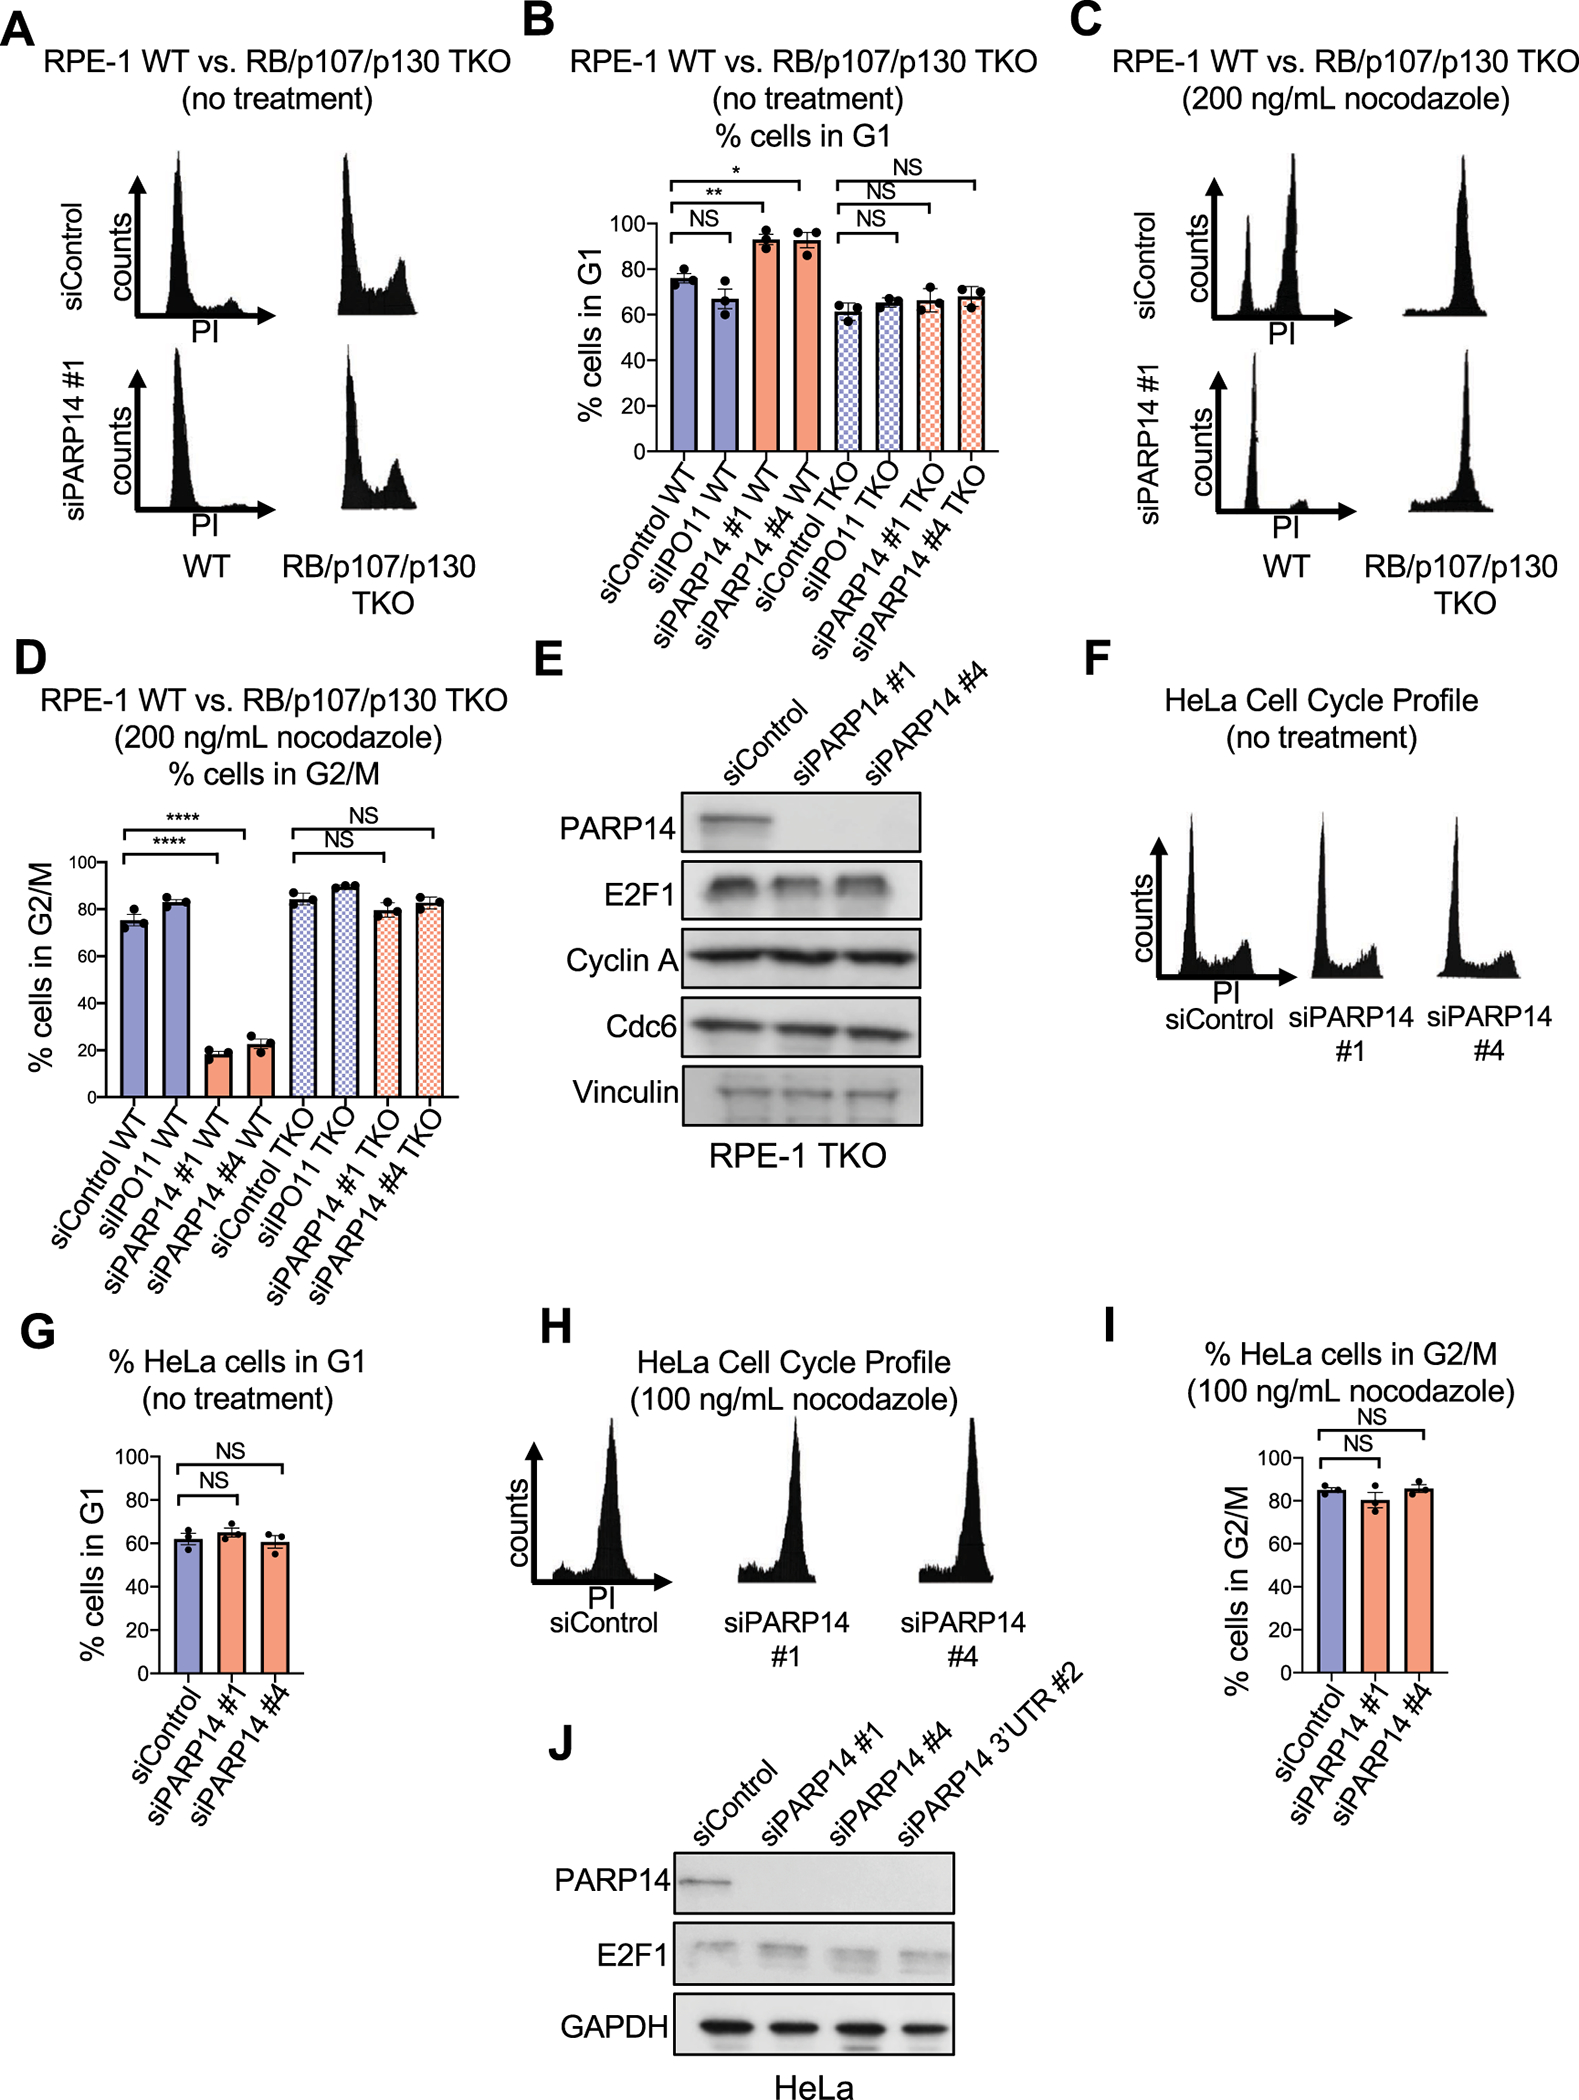
Figure 3. Cell cycle arrest due to PARP14 knockdown is not observed in RPE-1 RB/p107/p130 triple knockout cells or HeLa cells.

A. Cell cycle profiles of RPE-1 WT and RB/p107/p130 TKO cells after PARP14 knockdown. B. Quantification showing the percent of RPE-1 WT and RB/p107/p130 TKO cells in G1 cell cycle phase upon PARP14 knockdown. IPO11 knockdown was used as a second control. Bars represent the means ± SEM (t-test, unpaired). C. Cell cycle profiles of RPE-1 WT and RB/p107/p130 TKO cells after PARP14 knockdown and subsequent treatment with 200ng/mL nocodazole for 24h. D. Quantification showing the percent of RPE-1 WT and RB/p107/p130 TKO cells in G2/M cell cycle phase upon PARP14 knockdown and subsequent treatment with 200ng/mL nocodazole for 24h. Bars represent the means ± SEM (t-test, unpaired). E. Western blots showing the levels of E2F1 and its targets Cyclin A and Cdc6 upon PARP14 knockdown in RPE-1 RB/p107/p130 TKO cells. F. Cell cycle profiles of HeLa cells after PARP14 knockdown. G. Quantification showing the percent of HeLa cells in G1 cell cycle phase upon PARP14 knockdown. Bars represent the means ± SEM (t-test, unpaired). H. Cell cycle profiles of HeLa cells after PARP14 knockdown and subsequent treatment with 100ng/mL nocodazole for 24h. I. Quantification showing the percent of HeLa cells in G2/M cell cycle phase upon PARP14 knockdown and subsequent treatment with 100ng/mL nocodazole for 24h. Bars represent the means ± SEM (t-test, unpaired). J. Western blots showing the levels of E2F1 upon PARP14 knockdown in HeLa cells.
