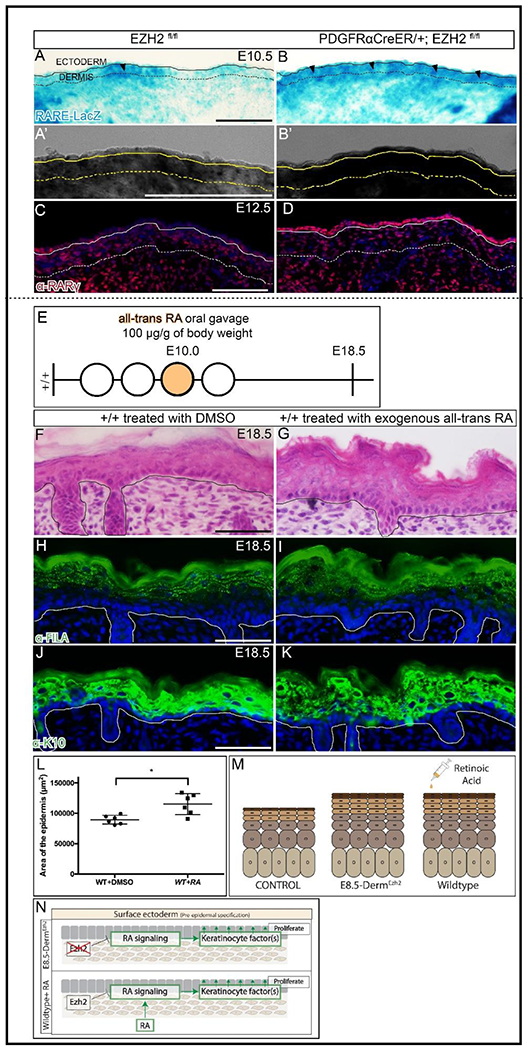
Figure 5: Retinoic acid is regulated by Ezh2 and is sufficient to induce epidermal hyperplasia:

β-galactosidase staining of RARE-LacZ (A, B) along with a digital zoom of a transmitted light channel using a confocal microscope (A’, B’) at E10.5. Indirect immunofluorescence with DAPI counterstain showing the expression of RA signaling target gene, RARγ (C, D) at E12.5. Schematic illustration of Retinoic Acid (E) gavage regimen. Hematoxylin and eosin staining of dorsal skin (F, G) showing the histology of the epidermis. Indirect immunofluorescence of FILAGGRIN (H, I) and KERATIN10 (J, K) with DAPI counterstain at E18.5. Comparison of epidermal area between controls and mutants in Retinoic acid treated mice (L). A summary schematic depicting the epidermal hyperplasia phenotype (M) and the relationship between EZH2 and retinoic acid signaling (N). Solid line demarcates the epidermis from dermis and dashed line demarcates the lower limit of the dermis. Scale Bar= 100 microns in A-D and 50 microns in F-K.
