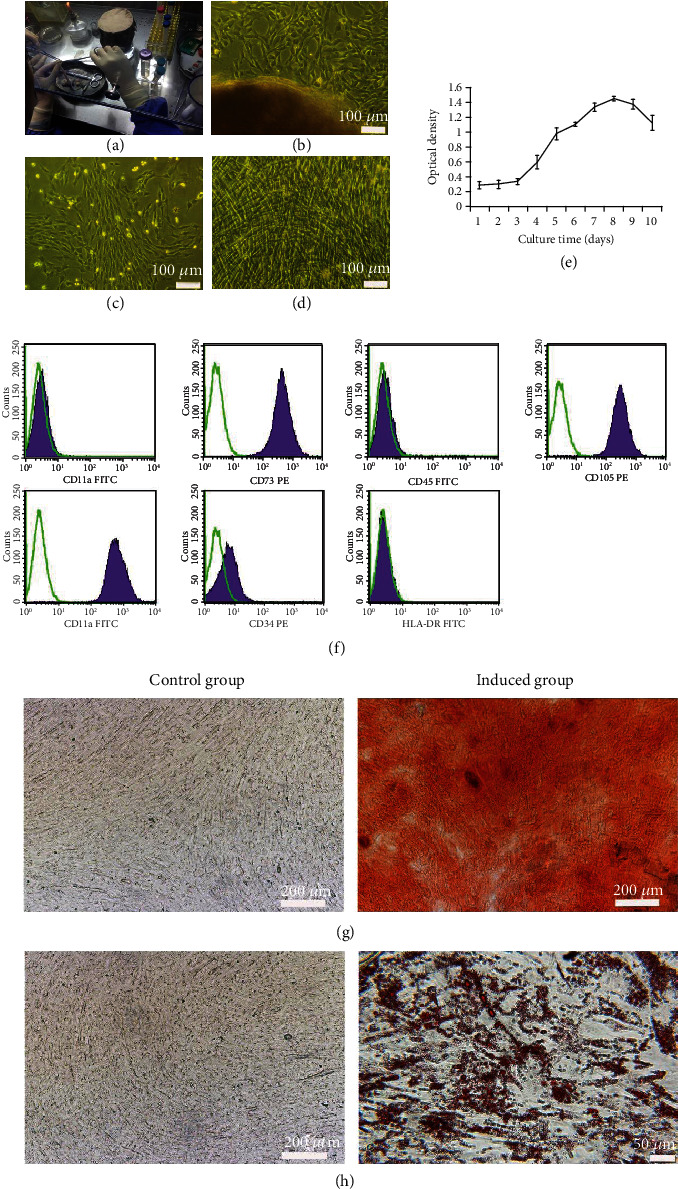
Figure 2.

Characteristics of hUC-MSCs. (a) Umbilical cord. (b) Tissue explant culture of hUC-MSCs (scale bar = 100 μm). (c) Phase 3 hUC-MSCs on day 1 of culture (scale bar = 100 μm). (d) Phase 3 hUC-MSCs on day 4 of culture (scale bar = 100 μm). (e) Proliferation of hUC-MSCs was evaluated using a CCK-8 assay (mean ± SD, n = 12). (f) Phenotype of hUC-MSCs. Green line indicates isotype control; purple-shaded histograms indicate positive staining. (g) Alizarin red staining on day 21 of culture (scale bar = 200 μm). (h) Oil red O staining on day 21 of culture (control group scale bar = 200 μm, induced group scale bar = 50 μm).
