Figure 2.

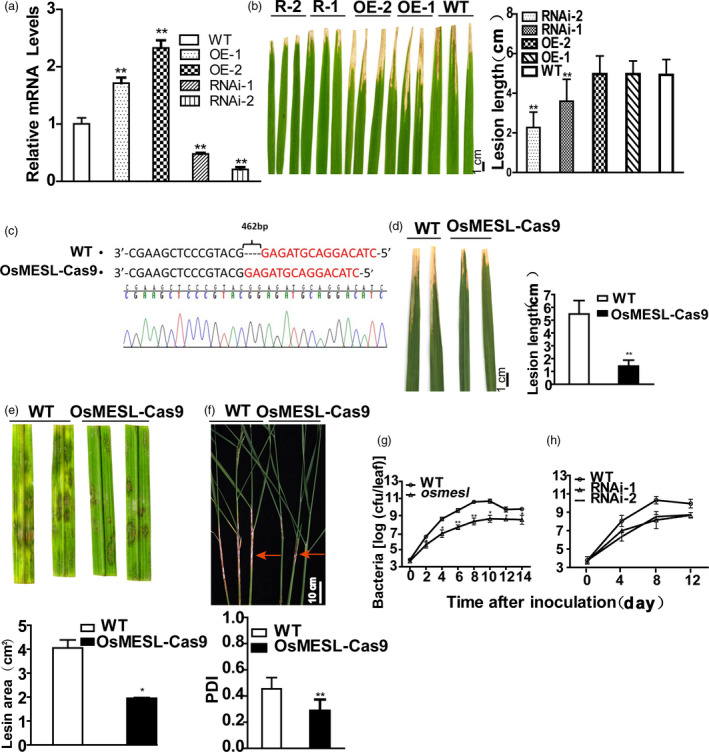
OsMESL‐RNAi and KO plants show resistance to Xoo and sheath blight, and Xoo growth was inhibited in OsMESL‐RNAi and KO plants. (a) mRNA expression levels of RNAi and OE lines. Values are means ± SD (n = 3). (b) Phenotypes and lesion length of RNAi‐1, RNAi‐2, OE‐1, OE‐2 and WT after inoculating with Xoo. Values are means ± SD (n = 10). (c) Sequecning of OsMESL KO plants for homozygous positive. (d) Phenotype and lesion length of OsMESL KO and WT inoculated with Xoo. Values are means ± SD (n = 13). (e) Detached leaves of OsMESL‐Cas9 plants inoculated with R. solani. Values are means ± SD (n = 3). (f) Phenotypes of OsMESL‐Cas9 plants and WT by toothpick method after inoculation with R. solani and the percentage disease index. Values are means ± SD (n = 12). (g–h) Xoo growth curve in WT, osmesl and RNAi lines. Values are means ± SD (n = 3) (*P ≤ 0.05, **P ≤ 0.01, Student’s t‐test).
