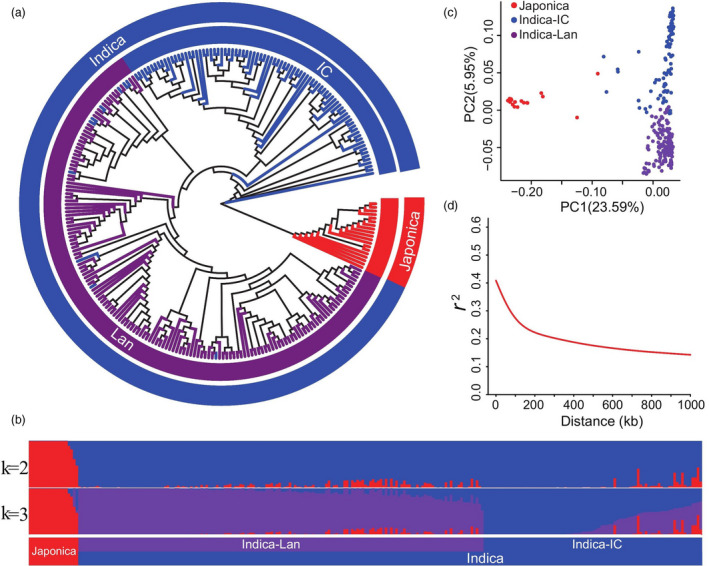
Figure 1.

Population structure of 259 rice accessions. (a) Population structure based on different numbers of ancestry kinships (K) set to 2 or 3. The x‐axis indicates the japonica (red), improved indica cultivar (IC, blue), and landrace (Lan, purple) subgroups. The left y‐axis quantifies genetic diversity in each accession. (b) Neighbour‐joining phylogenetic tree of 259 rice accessions based on 2 888 332 high‐quality SNPs; branch colours indicate different subgroups of rice, using the same colours as in (a). (c) Principal component analysis (PCA) plots of the first two components for all 259 rice accessions, using the same colours as in (a). (d) Genome‐wide average linkage disequilibrium (LD) decay rate of 259 rice accessions.
