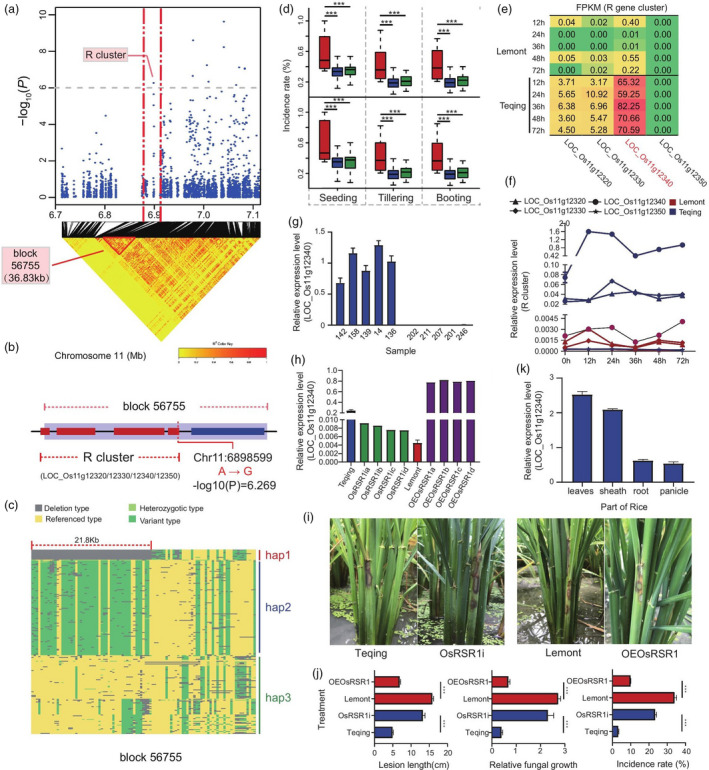
Figure 3.

OsRSR1 regulates RSB resistance. (a) Manhattan plots of loci on chromosome 11 associated with RSB incidence at the tillering stage at Wenjiang in 2017 (Tillering_2017_WJ). Arrowheads indicate significantly associated SNPs located in a nucleotide‐binding site leucine‐rich repeat proteins encoded (R) gene cluster. Horizontal dashed lines indicate the significance threshold (P < 10−6). LD heat map (bottom) reflected that associated SNP localized in a haploid between the red dashed lines. (b) This haploid (named block 56 755) contains the R gene cluster mentioned above, which included four R genes LOC_Os11g12320, LOC_Os11g12330, LOC_Os11g12340 and LOC_Os11g12350. Red rectangles indicate four R genes, respectively. (c) Three haplotypes were identified through sequence analysis of R gene cluster. Blue areas indicated deletion type mapping to reference genomes (hap1); green areas indicated variant type mapping to reference genomes (hap2); yellow areas indicated consistent with reference genomes (hap3). (d) Box plots for RSB resistance, based on the genotypes of sequence analysis of R cluster. The horizontal line in the centre of each box denotes the median. The upper and lower limits of each box represent quartiles; whiskers indicate the range of the data; statistical significance of differences was analysed by the two‐tailed t‐test. Hap1, hap2 and hap3 are shown in red, blue and green, respectively. (e) Expression of four genes in the R gene cluster in resistant and susceptible rice lines (Transcriptome data). Each row corresponds to a time result. Each column corresponds to a gene. The expression level is coloured based on their FPKM value: red indicates a high expression and green indicates a low expression. (f) Verification of four R genes expression in resistant and susceptible rice lines at different infection time points by qRT‐PCR. (g) Expression analysis of OsRSR1 in five resistant and five susceptible varieties at 24 h postinoculation (hpi) of Rhizoctonia solani AG1‐IA by qRT–PCR. (h) Identification of overexpression (OE) and RNA interference (RNAi) lines of OsRSR1 by qRT–PCR. (i) Incidence of OsRSR1‐OE plants was decreased compared with WT, and the incidence of OsRSR1‐RNAi plants was increased compared with WT. (j) Average incidence rate (n = 10 sheath) of Teqing, OsRSR1‐RNAi lines, Lemont, and OsRSR1‐OE lines at 4 day post inoculation (dpi) with R. solani AG1‐IA. (k) Expression analysis of OsRSR1 in different tissues of rice by qRT–PCR (leaves, sheath, root and panicle). The rice UBQ gene was used as an internal control. Data are represented as average values with four biological replicates (e–h, and k).
