
Figure 2.
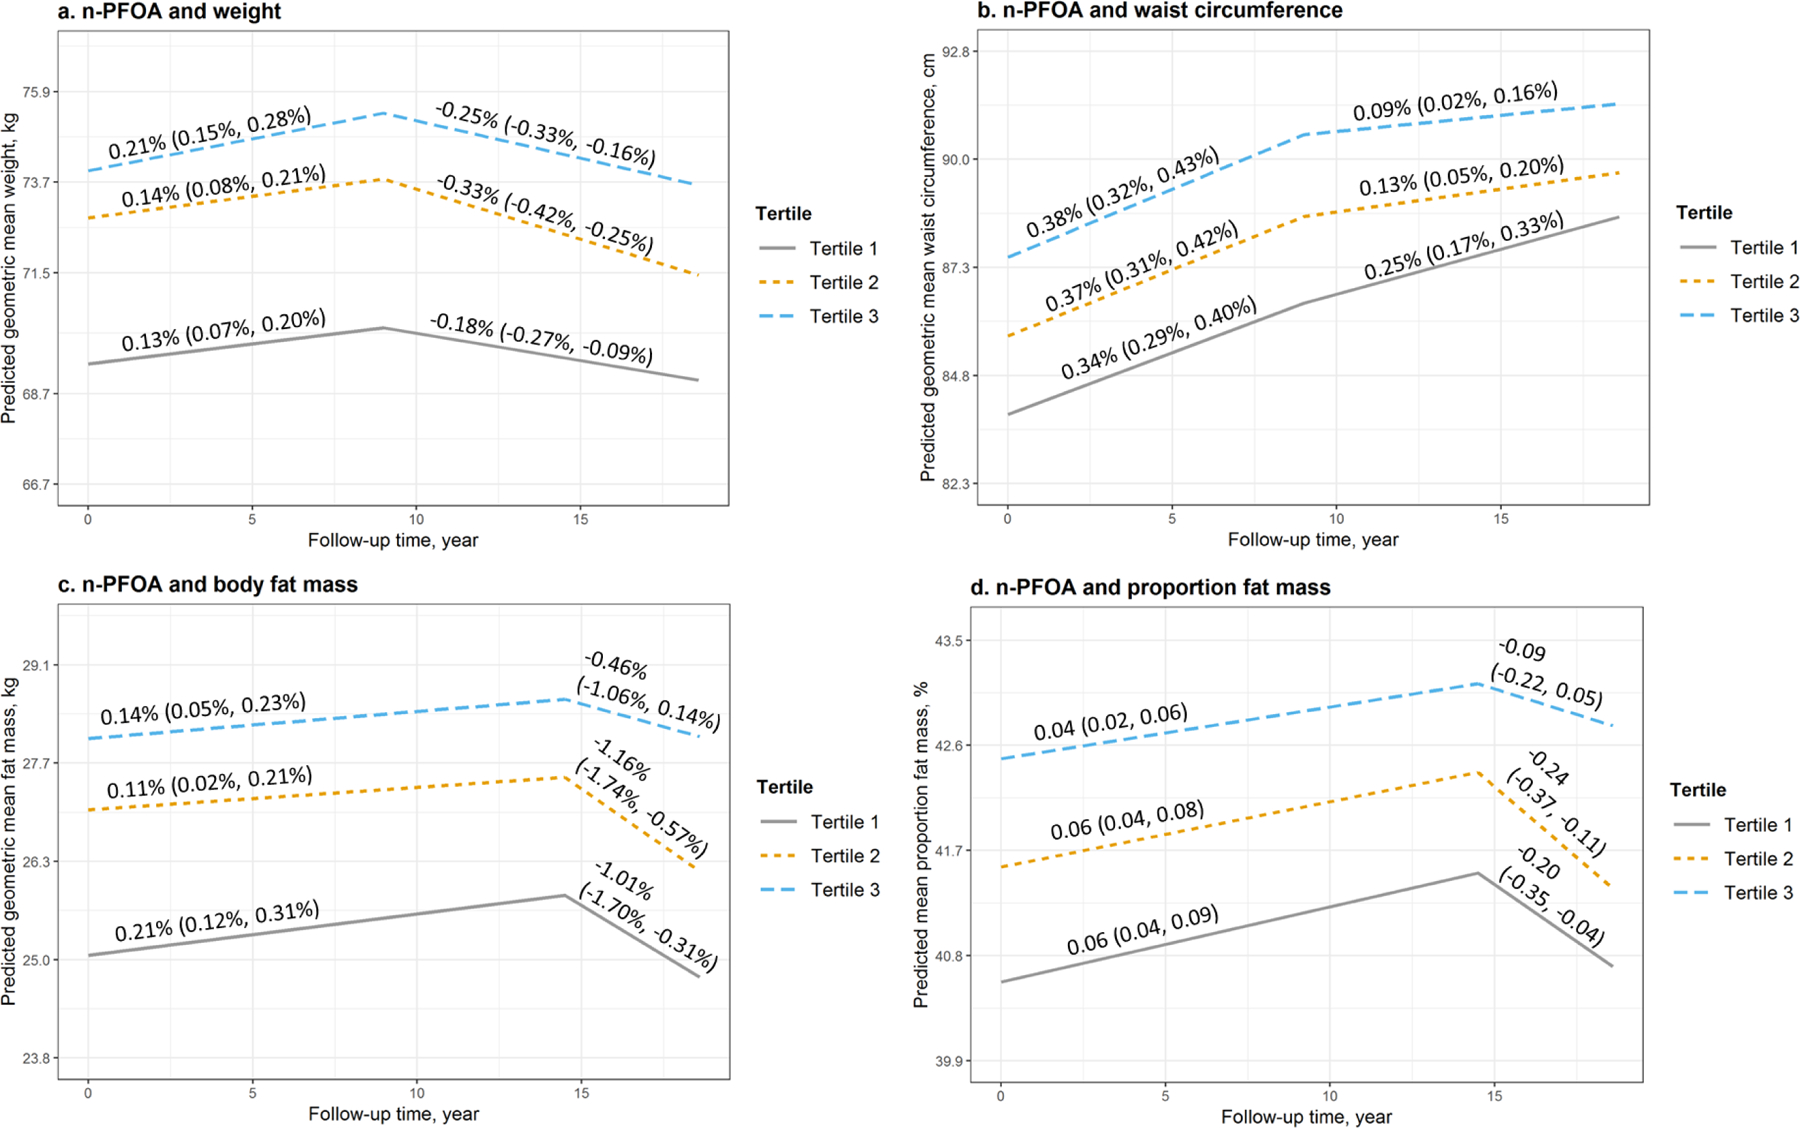
Predicted geometric mean (95% confidence interval, 95% CI) and annual rate of changes (95% CI) of a. weight, b. waist circumference, c. body fat mass, and d. proportion fat mass by tertiles of serum concentrations of n-PFOA at baseline and during the follow-up. Models were adjusted for age at baseline, race, study site, education, financial strain, smoking status, passive smoking, alcohol consumption, total calorie intake, physical activity, and menopausal status. Medians (ranges) of n-PFOA concentrations by tertiles were 2.4 (<LOD, 3.2) ng/mL for tertile 1, 4.1 (3.3, 5.1) ng/mL for tertile 2, and 6.8 (5.2, 56.5) ng/mL for tertile 3.