Figure 2.

Monocyte-Macrophage diversity in Dermatomyositis Skin
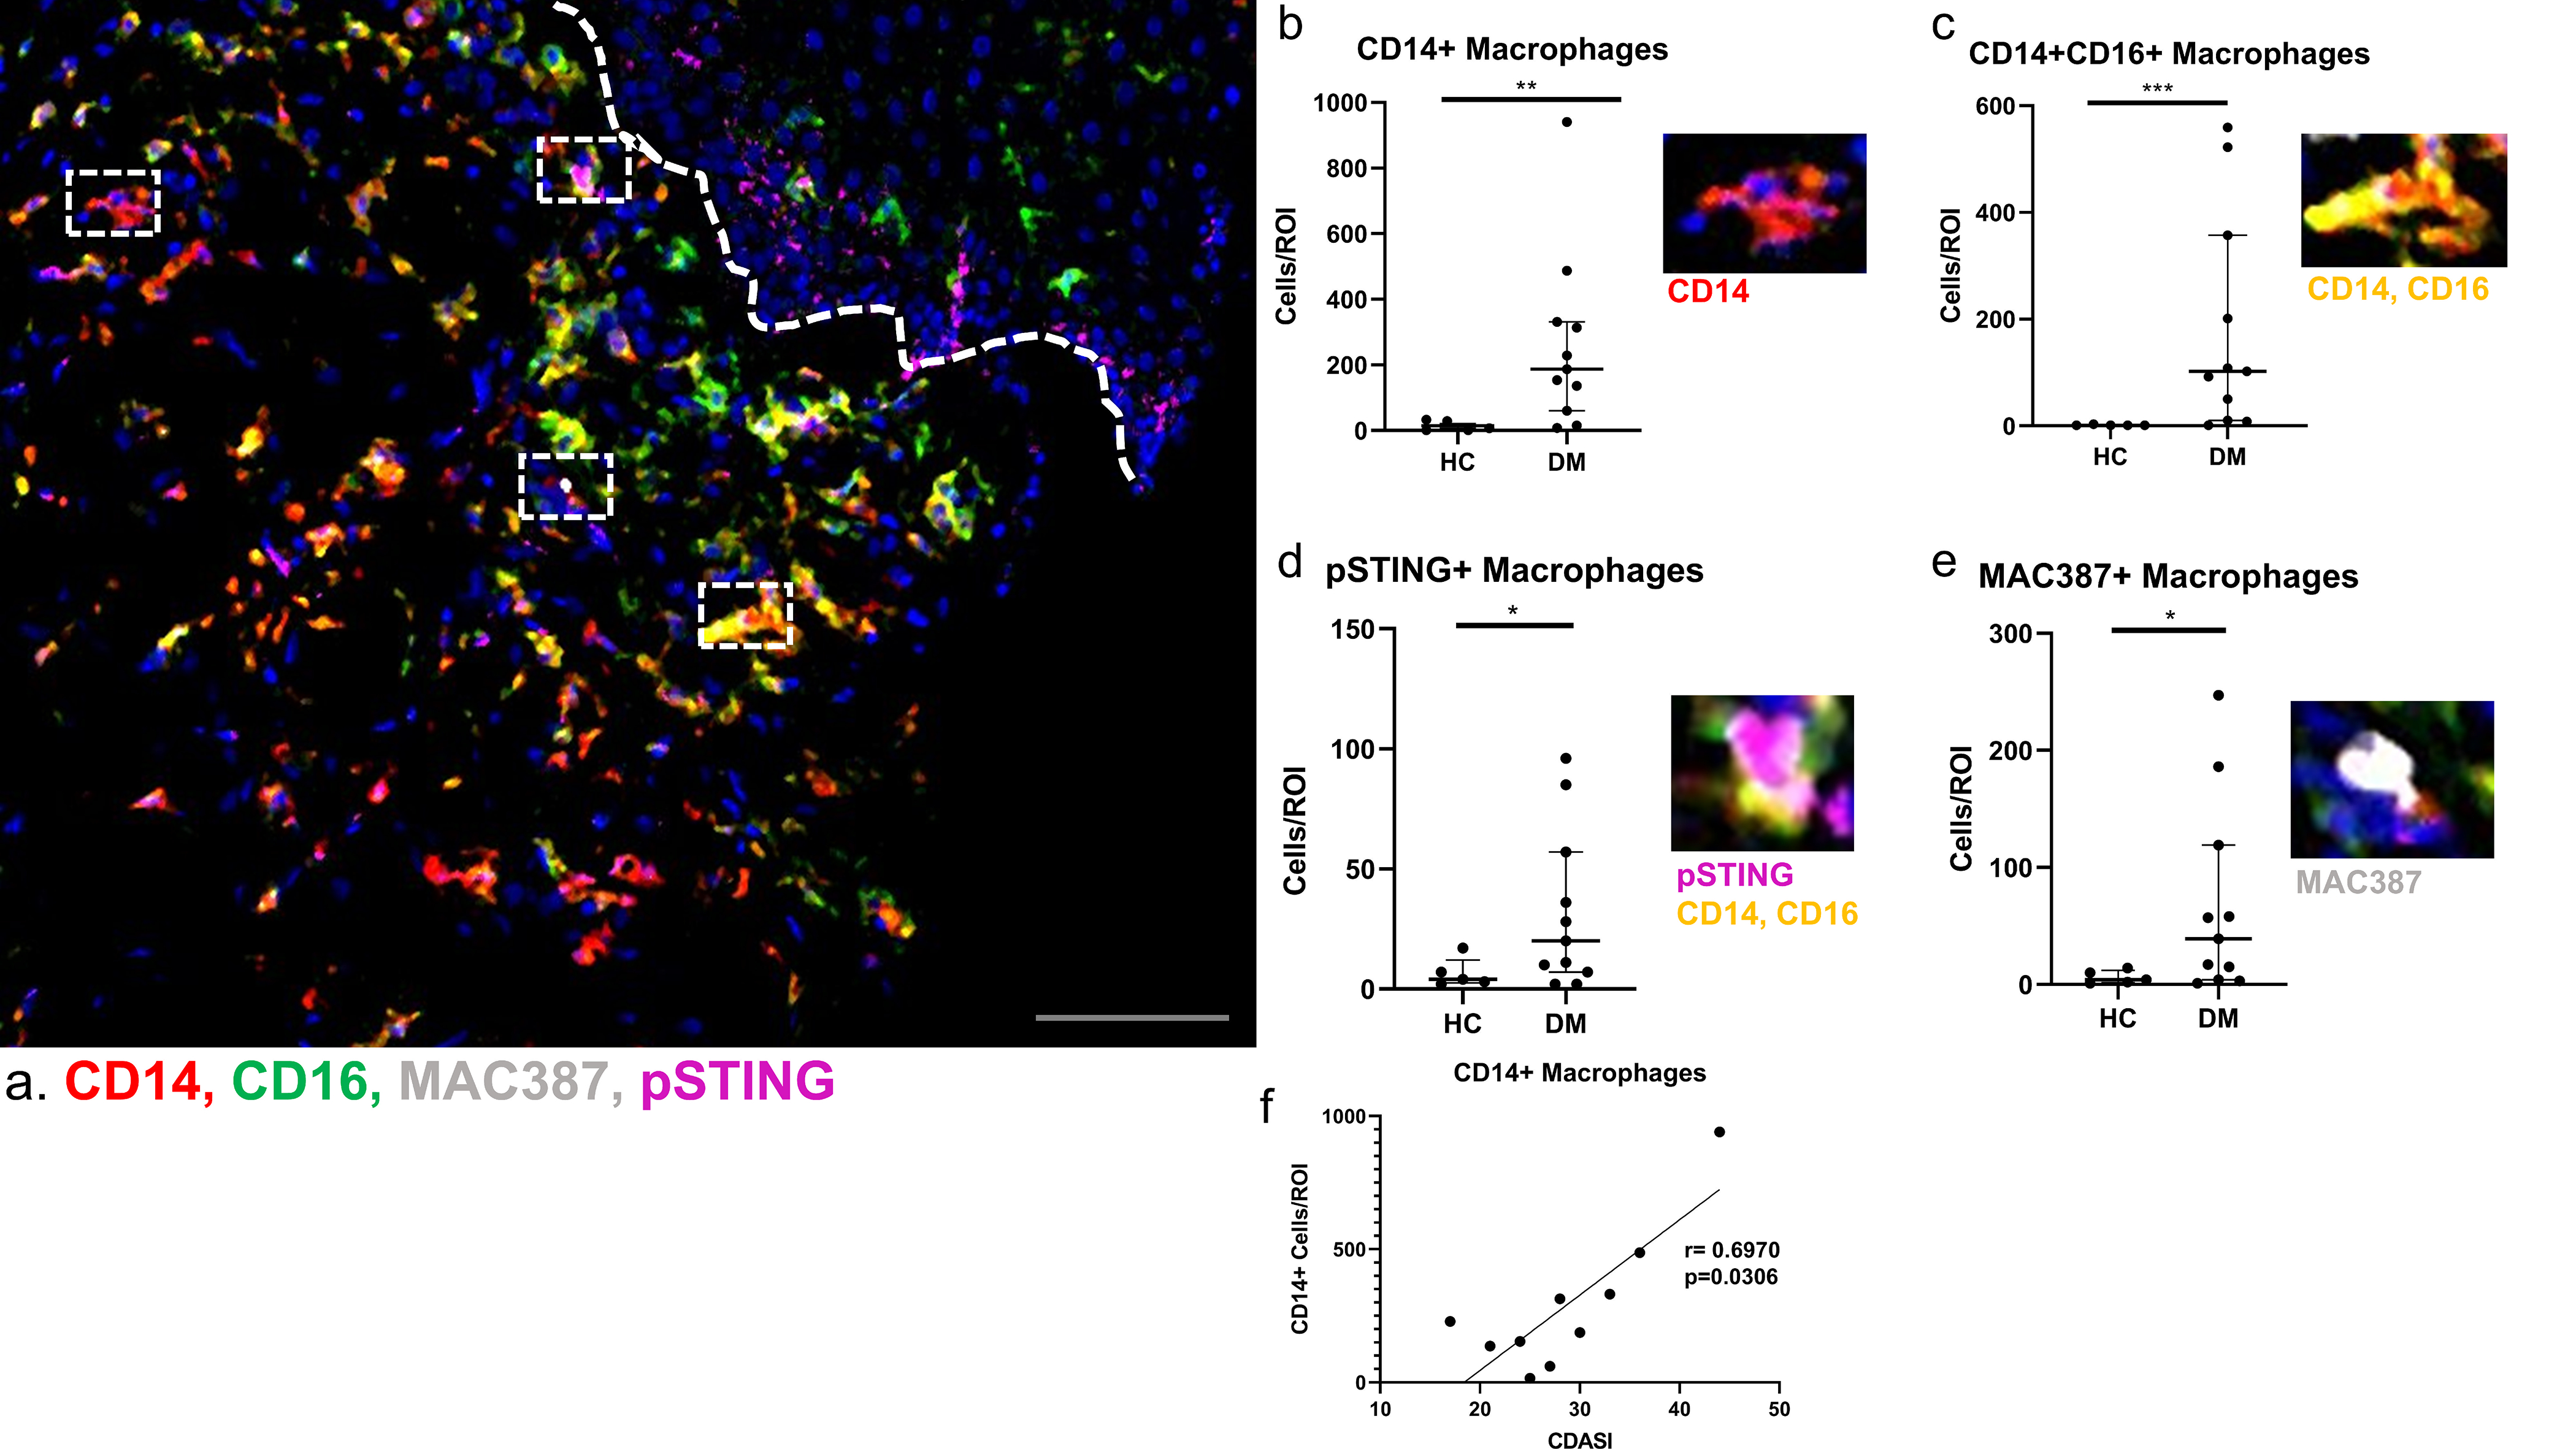
a) Multiplexed image depicting CD14+ (red), CD16+ (green), Nuclei (blue), MAC387+ (white), and pSTING+ (magenta) cells. b-e) In DM skin there are increased numbers of b) CD14+ macrophages (red), c) CD14+CD16+ macrophages (yellow), d) MAC387+ macrophages (white), and e) pSTING+ macrophages (magenta) cells compared to HC skin. Dermal-epidermal junction shown with white dotted line. Representative images from a) shown next to corresponding graphs with nuclei seen with Ir-DNA (blue). f) Correlation of the CDASI scores from cutaneous DM lesions revealed a positive correlation with CD14+ macrophages. Scale bar=120 μm (gray). Data are represented as median ± IQR. * p<0.05, ** p<0.01, *** p<0.001
