
Figure 5.
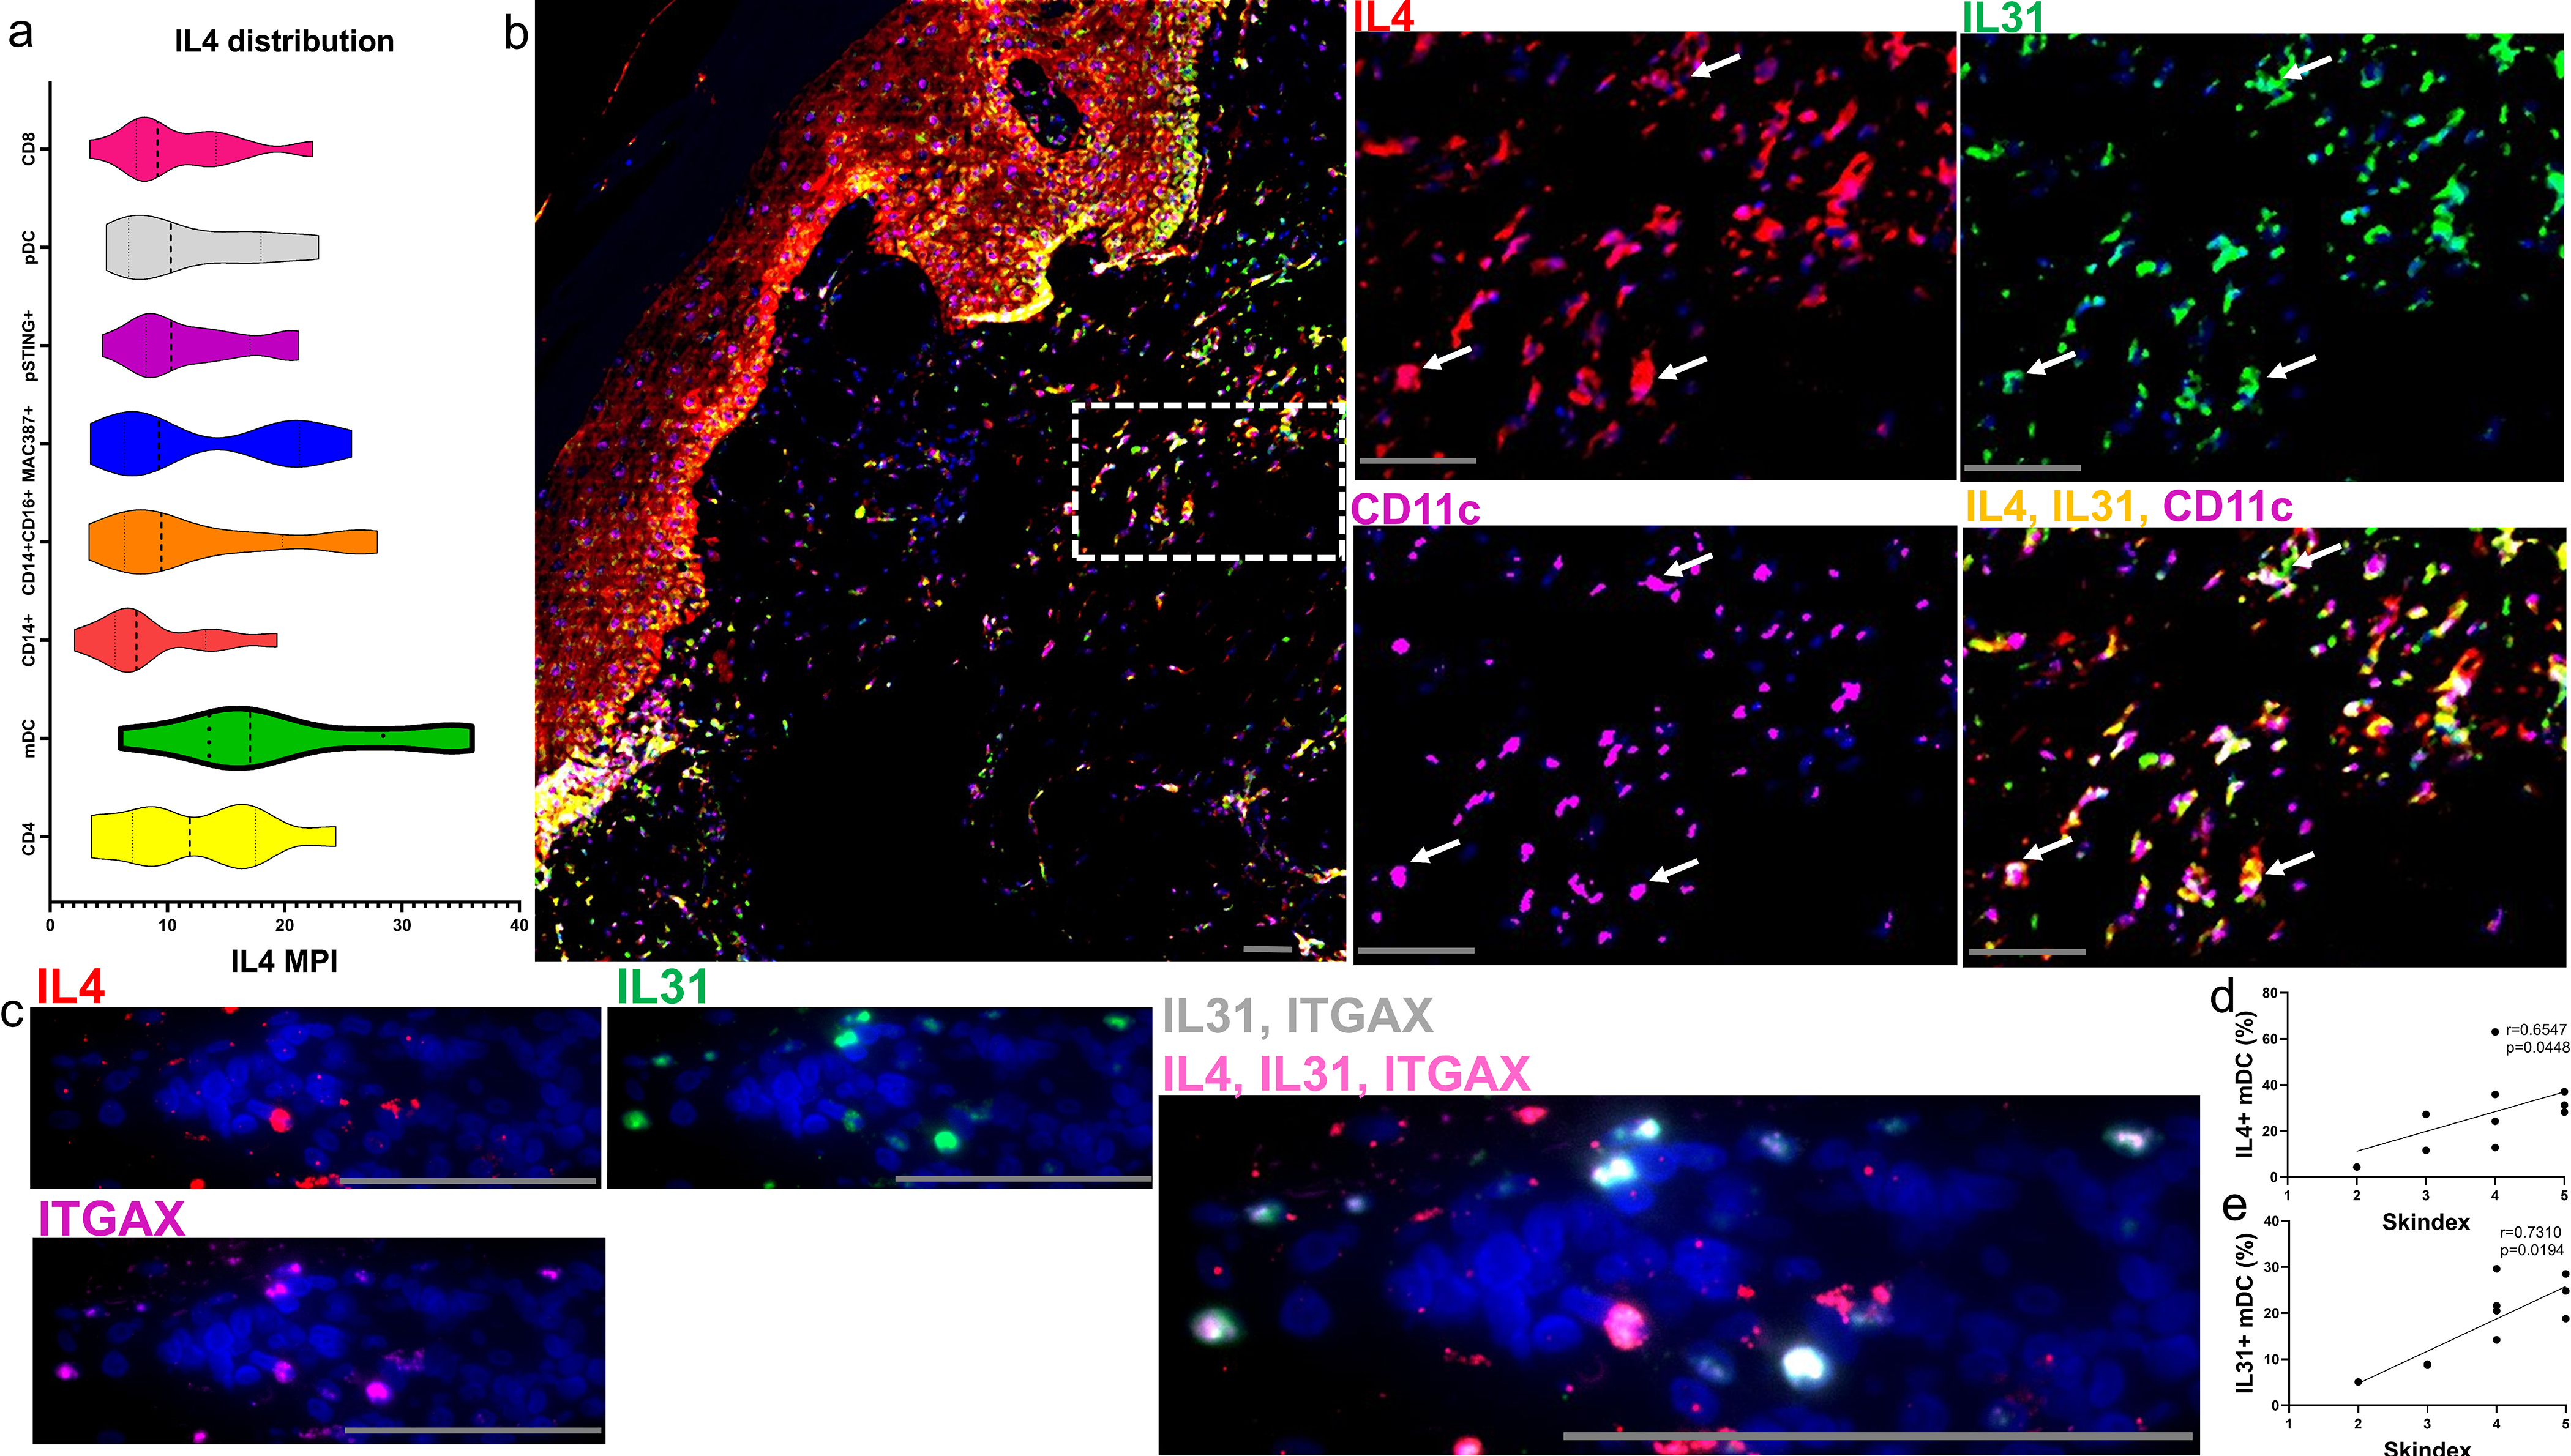
CD11C+ mDCs co-express IL4, IL31 and correlate with the Skindex-29 itch score a) The distribution of IL4 amongst different cell types in DM skin shows a trend for mDCs being the major producers followed by CD4 T Cells. b) IMC of a DM skin lesions reveals an image of IL4(red), IL31(green), and CD11C (magenta). Corresponding dotted region from (b) shown at a higher magnification with IL4(red), IL31(green), and CD11C (magenta). Colocalization of IL4 and IL31 can be seen (yellow) and overlaps with CD11C+ cells (magenta) with white arrows highlighting corresponding mDCs. c) ISH images of mRNA similarly show IL4+ (red), IL31+ (green), and ITGAX+ mDCS (CD11C gene, magenta) with IL4+, IL31+, and IL4+IL31+ mDCs. Single positive IL4 mDCs are seen by red arrows, single positive IL31 mDCs by green arrows and double positive IL4+IL31+ mDCs by yellow arrows. d-e) Correlation with the Skindex-29 itch score showed a positive correlation for the percent of IL4+ mDCs (d) and percent of IL31+ mDCs (e). Nuclei represented with Ir-intercalator (b, blue) and DAPI (c). Scale bars (b-c, gray)= 60 μm. Data are represented as median ± IQR. See Figure S4