
Figure 1: Exonuclease validation experiment for PAGE versus CE.
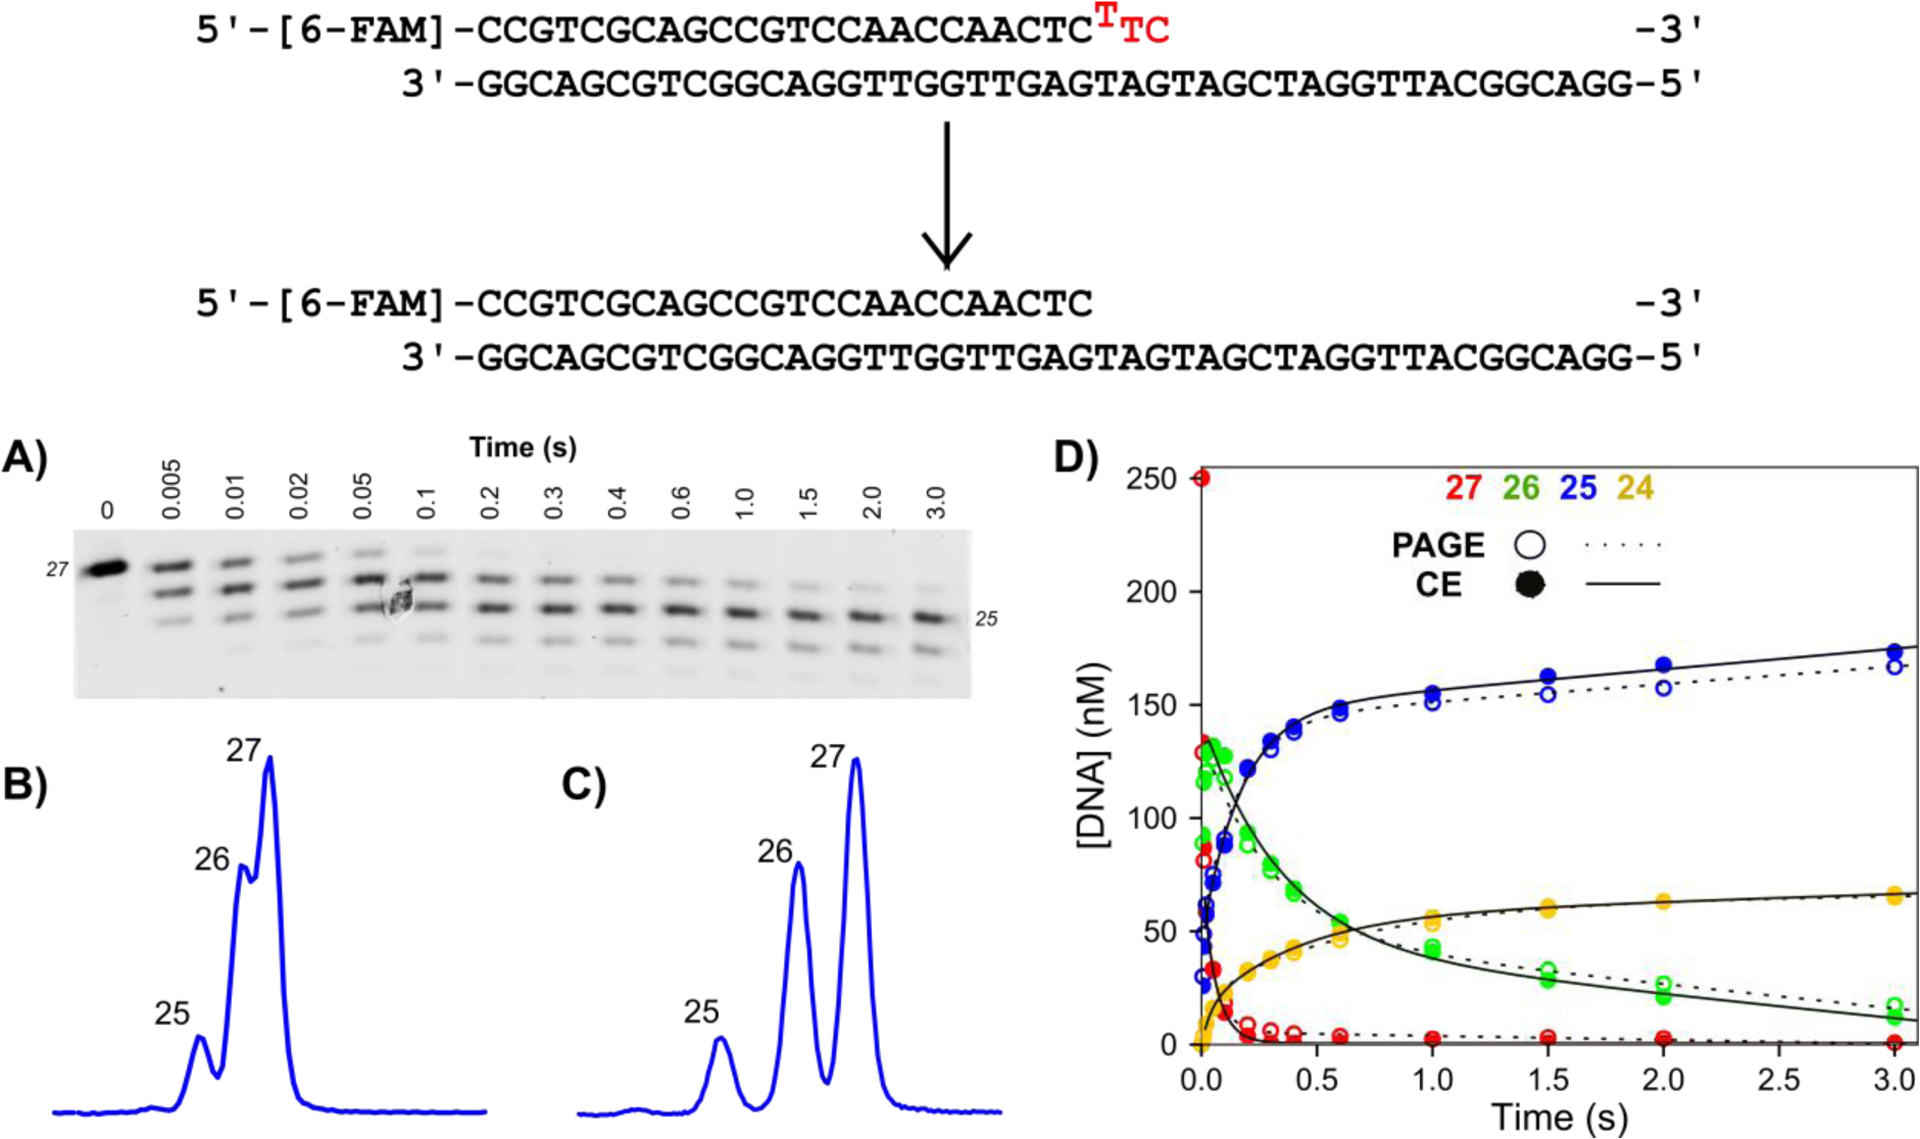
Scheme: The DNA substrate is a 27 nt, 5′-[6-FAM]-labeled primer annealed to the 45 nt template, with a buried T:T mismatch at the n-2 position. Bases to be removed are shown in red. Reaction conditions: A solution of 1.25 μM T7 DNA polymerase, 25 μM thioredoxin, 0.1 mg/ml BSA, and 12.5 mM Mg2+ was mixed with 250 nM FAM-labeled DNA from the other syringe in the quench flow at 20°C to start the reaction. Time points were quenched by mixing with EDTA from the quench syringe to a final concentration of 0.3 M. A) Analysis of time points by denaturing PAGE. Samples were mixed with formamide loading dye, separated by denaturing PAGE with 15% acrylamide/7M urea, and scanned on a Typhoon 9500 scanner with the FAM fluorescence filter. B) Separation of 5 ms time point by CE with POP-7 polymer. The same samples from (A) were injected at 1.6 kV for 15 seconds. Three peaks are visible, however lack of separation between products make quantification difficult. C) Separation of 5 ms time point by CE with POP-6 polymer. The same samples from (A) were injected with the same parameters as in (B). Each product is well resolved to near baseline, facilitating accurate peak integration. D) Overlay of data analyzed by PAGE versus CE. Data for products of varying lengths (27 nt, red; 26 nt, green; 25 nt, blue; 24 nt, yellow) for analysis by PAGE (open circles, dashed line) versus capillary electrophoresis (closed circles, solid line). Net rates and amplitudes obtained by fitting the data to a double exponential burst equation are identical for the two data sets within 2%.