
Figure 2: Single nucleotide incorporation experiment and internal standard normalization.
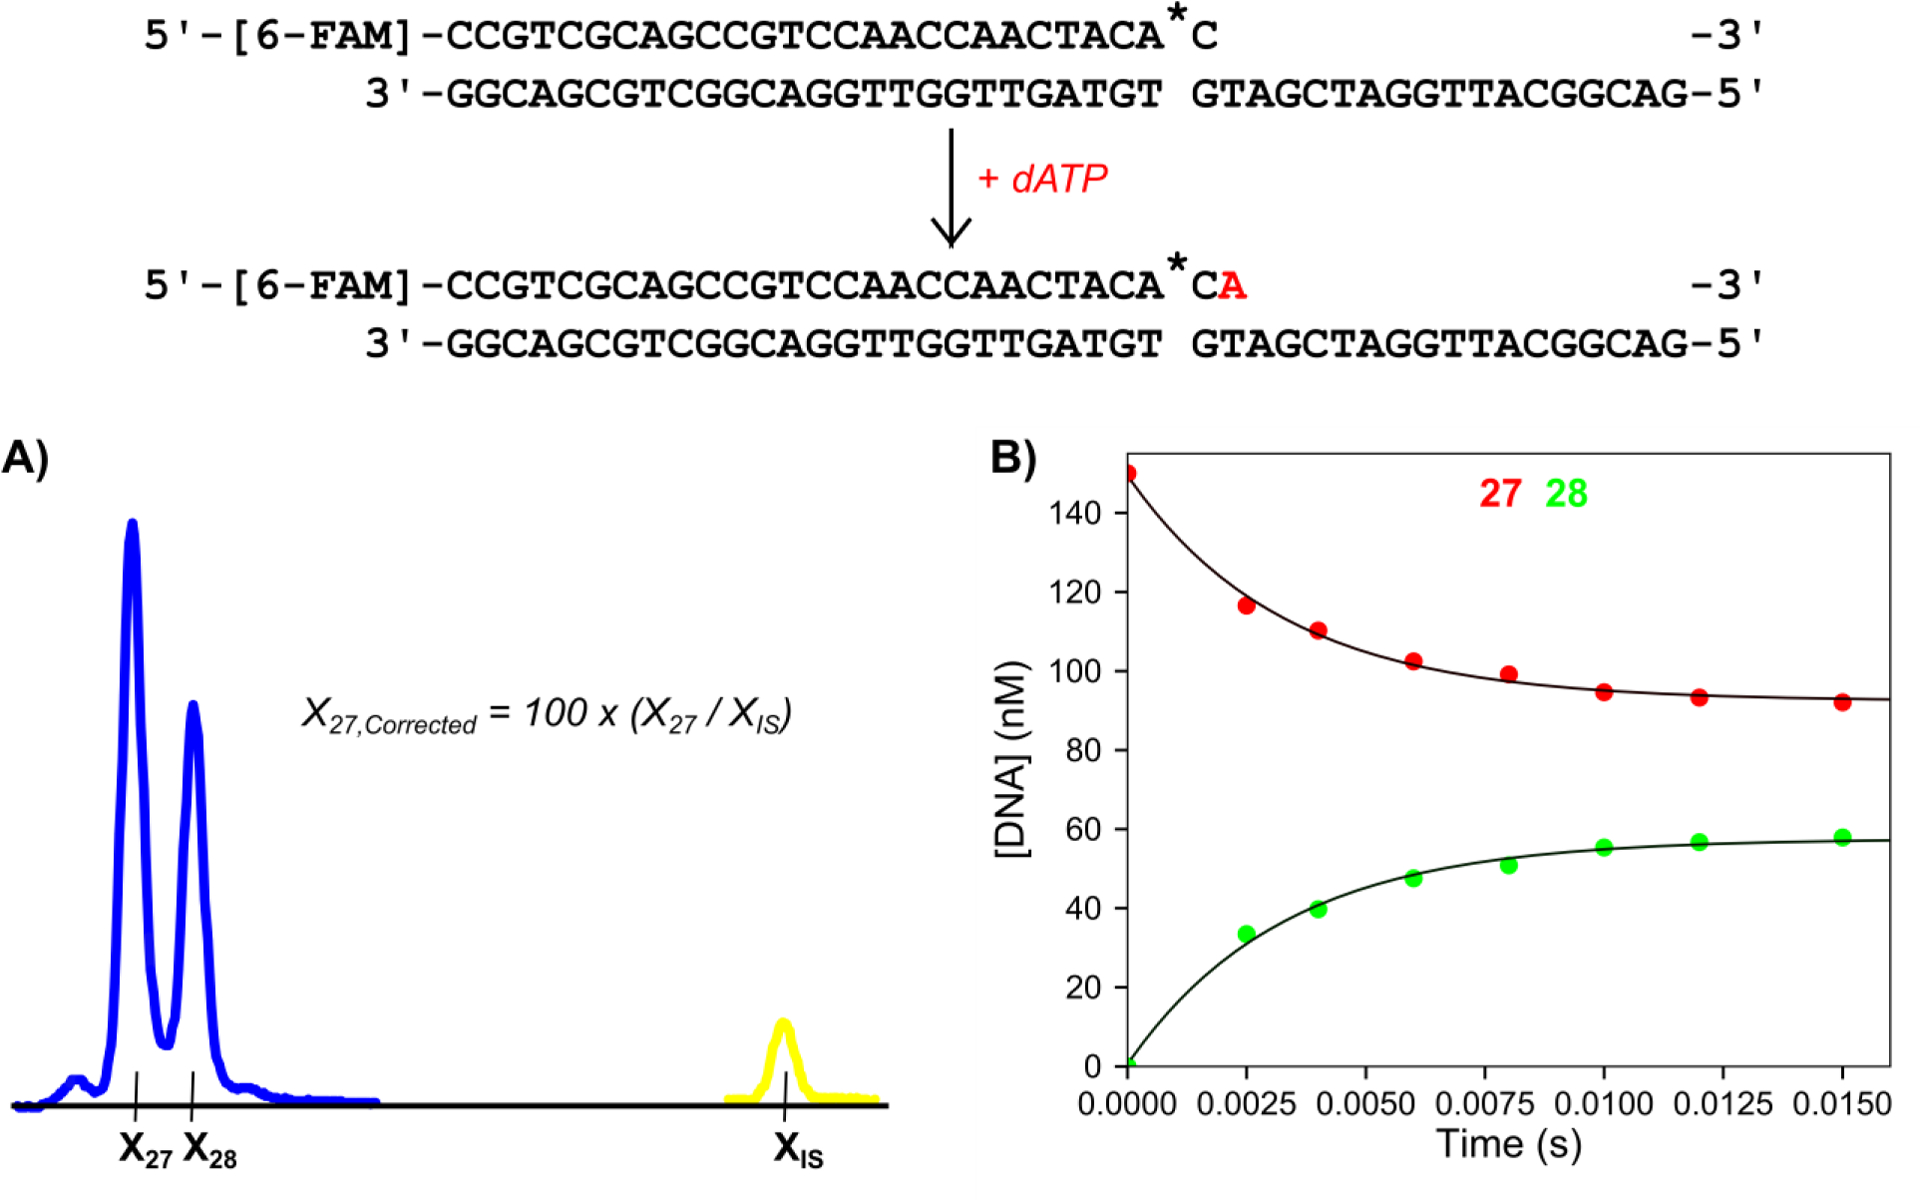
Scheme: The DNA substrate is a 27 nt, 5′-[6-FAM]-labeled primer containing a phosphorothioate linkage at the 3′ end (denoted by *), annealed to a 45 nt template strand. The added nucleotide is shown in red. Reaction conditions: A solution of 75 nM T7 DNA polymerase (exo−), 1.5 μM Thioredoxin, 0.1 mg/ml BSA, and 150 nM FAM-DNA was mixed with 100 μM dATP and 12.5 mM Mg2+ to start the reaction in the quench flow instrument at 20°C. Time points were quenched by mixing with EDTA from the quench syringe (0.3 M final concentration). A) Electropherogram showing the 15 ms time point with the Cy3 internal standard. Samples were injected for 15 seconds at 2.6 kV. Blue peaks correspond to FAM-labeled reaction products and the yellow peak corresponds to the Cy3-labeled internal standard. Xn is the migration time of the peak for DNA n nucleotides in length. XIS is the migration time of the Cy3 labeled internal standard oligo. The formula for the corrected migration time for the 27 nt peak is shown in the panel and is used to normalize the variable migration times between capillaries. B) Plot of DNA concentration versus time for varying length products derived from the burst experiment. The 27 nt primer is shown in red and the 28 nt primer is shown in green as a function of time. This representative data set is part of the included example data provided with the software. Both sets of data are shown fit to single exponential functions.