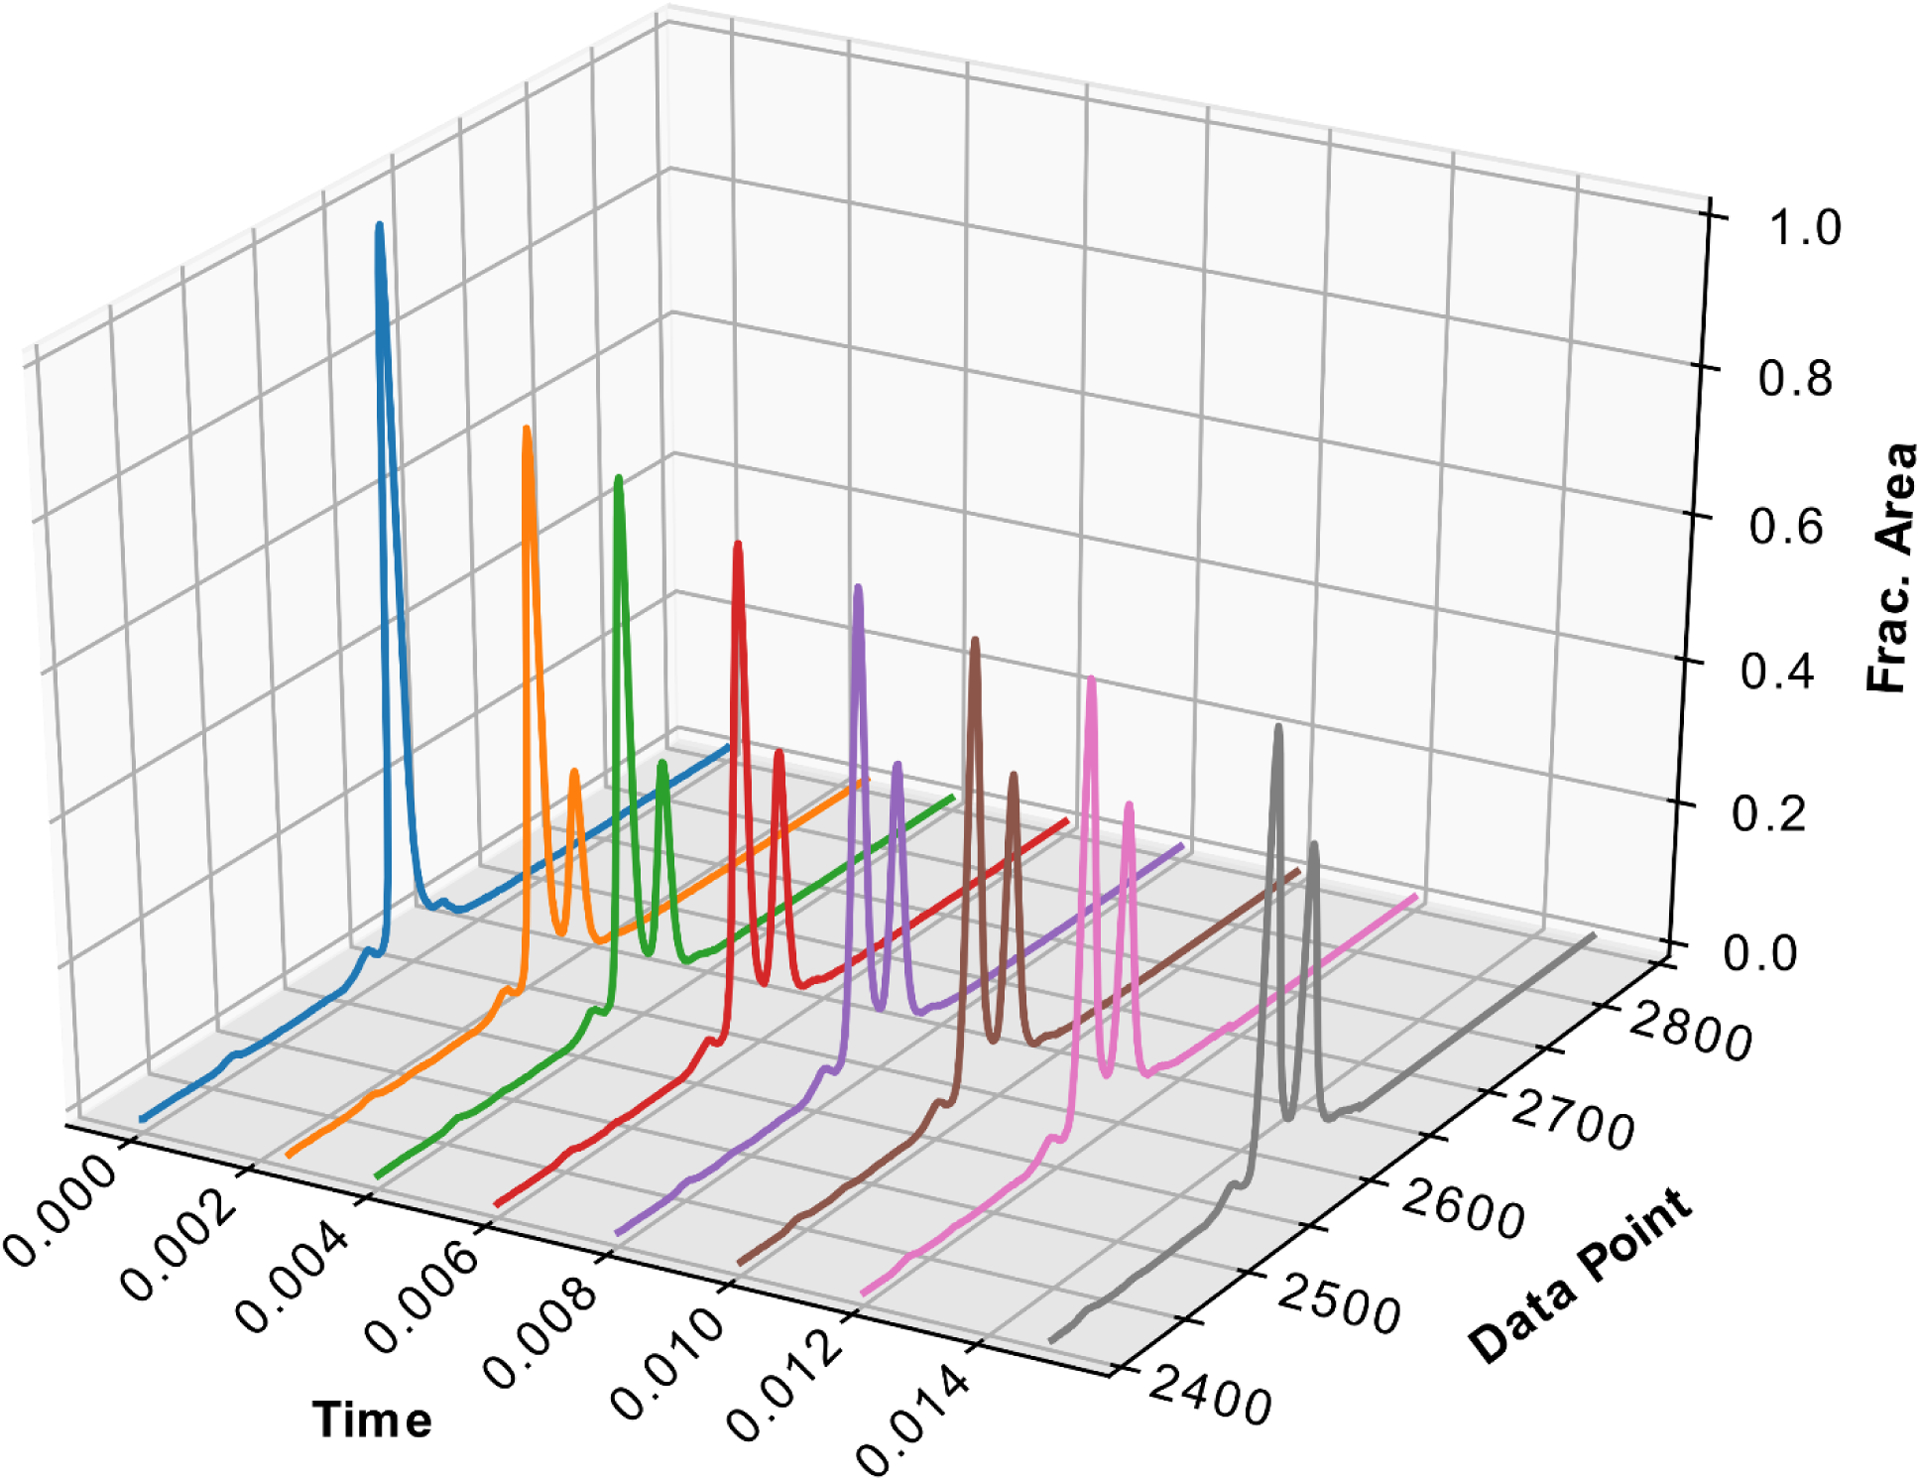
Figure 3: 3-D plot of aligned and normalized single nucleotide incorporation experiment electropherograms.

Data is from the experiment described in Figure 2. Time is shown on the X axis, “Data Point” shown on the Y-axis represents the normalized migration time (relative to the internal standard), and the fractional area normalized to peak height is shown on the Z-axis. The normalized migration time was calculated by the analysis software to correct for the differences in migration time between capillaries. Fractional area was calculated in the analysis software to determine a scaling factor for each electropherogram.
