
Figure 4: Validation of RNA separation and analysis by CE.
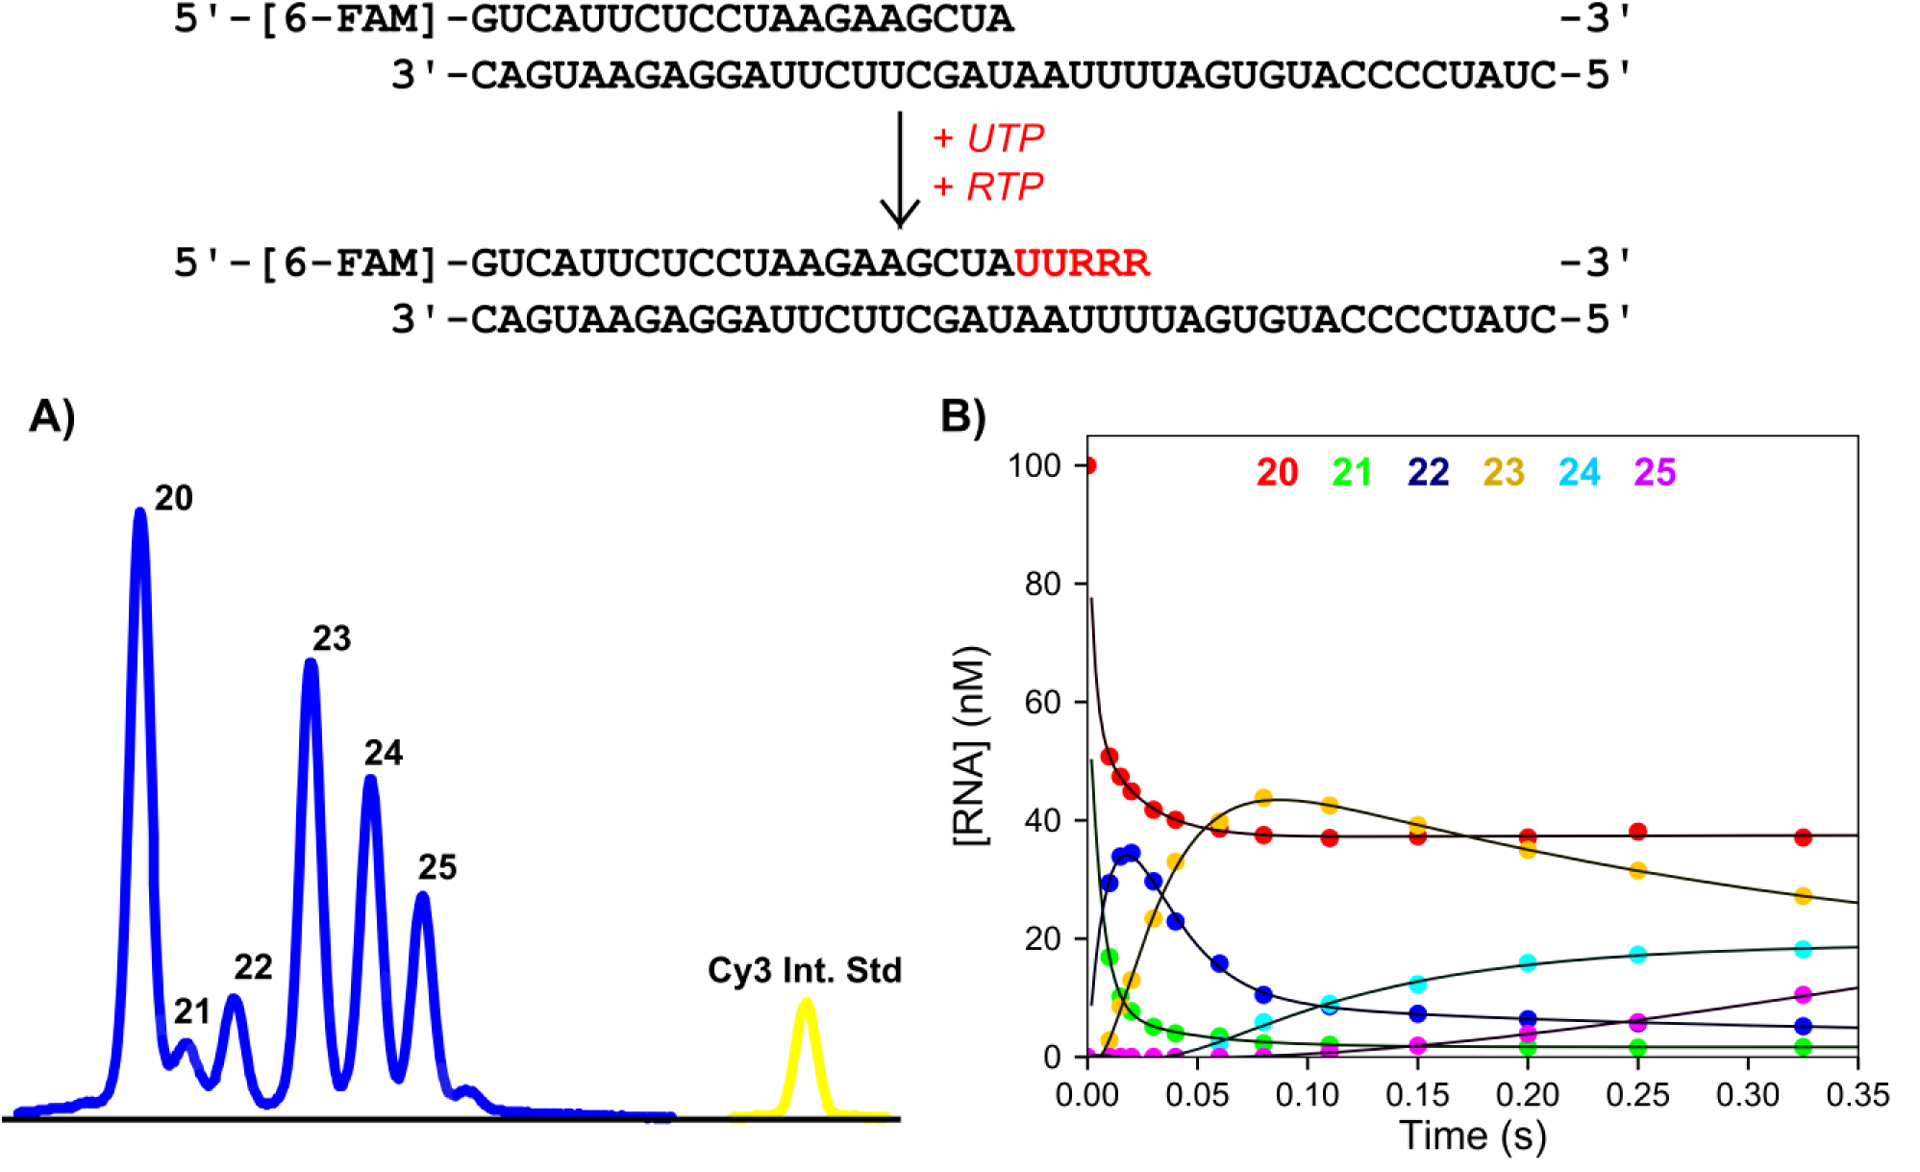
Scheme: The RNA substrate used in the kinetics assay is shown, consisting of a 20 nt, 5′-[6-FAM]-labeled primer annealed to a 40 nt template. UTP and Remdesivir triphosphate were added and the extended RNA bases are shown in red. Experimental conditions: A solution of 1.5 μM SARS CoV-2 RdRp (NSP12/7/8 plus 6 μM NSP8), 100 nM FAM-RNA, and 5 mM Mg2+ was mixed with 150 μM UTP and 40 μM Remdesivir-triphosphate to start the reaction in the quench flow at 37°C. Time points were quenched by mixing with EDTA from the quench syringe to 0.3 M. A) Sample electropherogram for a 0.325 second time point. Samples were injected for 6 seconds at 3.6 kV. Blue peaks correspond to FAM-labeled RNA products, while the yellow peak corresponds to the Cy3 internal standard. B) Concentration of RNA versus time. Data for different species were determined using the analysis software and are colored as listed in the top of the panel. Data are shown fit to a double exponentials function.