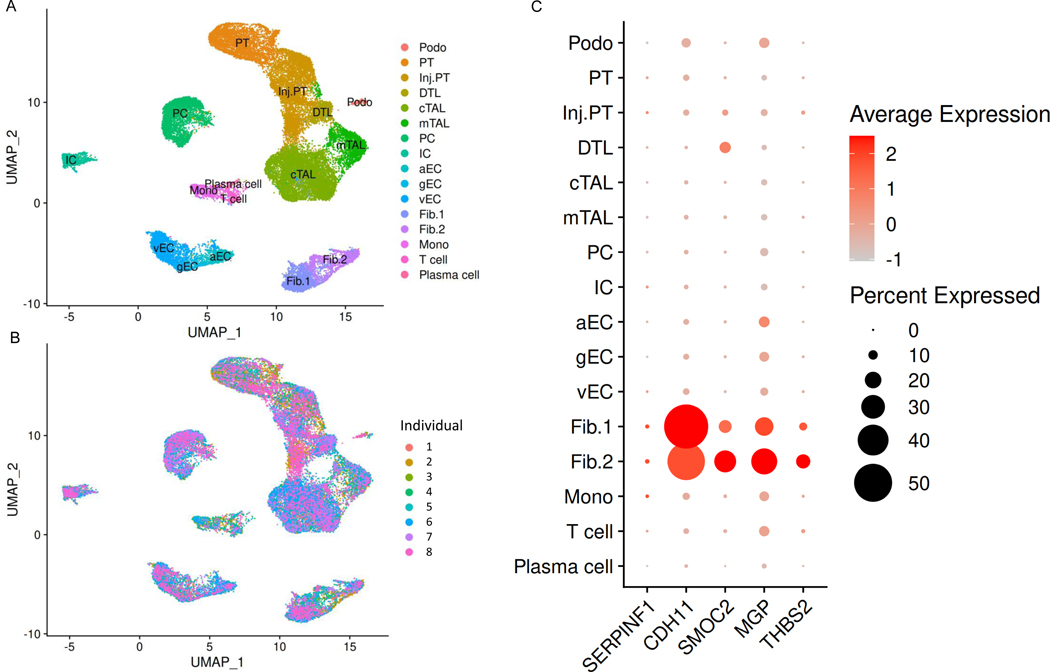
Figure 2. Single-nucleus RNA-sequencing analyses reveal biomarker gene expression in individuals with chronic kidney disease (CKD).
(A) Uniform manifold approximation and projection (UMAP) plot of 8 human kidneys from individuals with CKD reveals 16 separate cell clusters. (B) UMAP plot annotated by cell type and individual. (C) Dot plots shows quantification of gene expression across cell clusters. Podo, podocyte; PT, proximal tubule; Inj. PT, injured proximal tubule; DTL: descending limb of Loop of Henle; cTAL, cortical thick ascending limb of Loop of Henle; mTAL, medullary thick ascending limb of Loop of Henle; PC, principal cell; IC, intercalated cell; aEC, arterial endothelial cells; vEC, venous endothelial cells; gEC, glomerular endothelial cells; Fib., fibroblasts type 1; Fib. 2, fibroblasts type 2; Mono, monocyte. The SERPINF1 (Serine Proteinase Inhibitor-F1) gene encodes PEDF.

