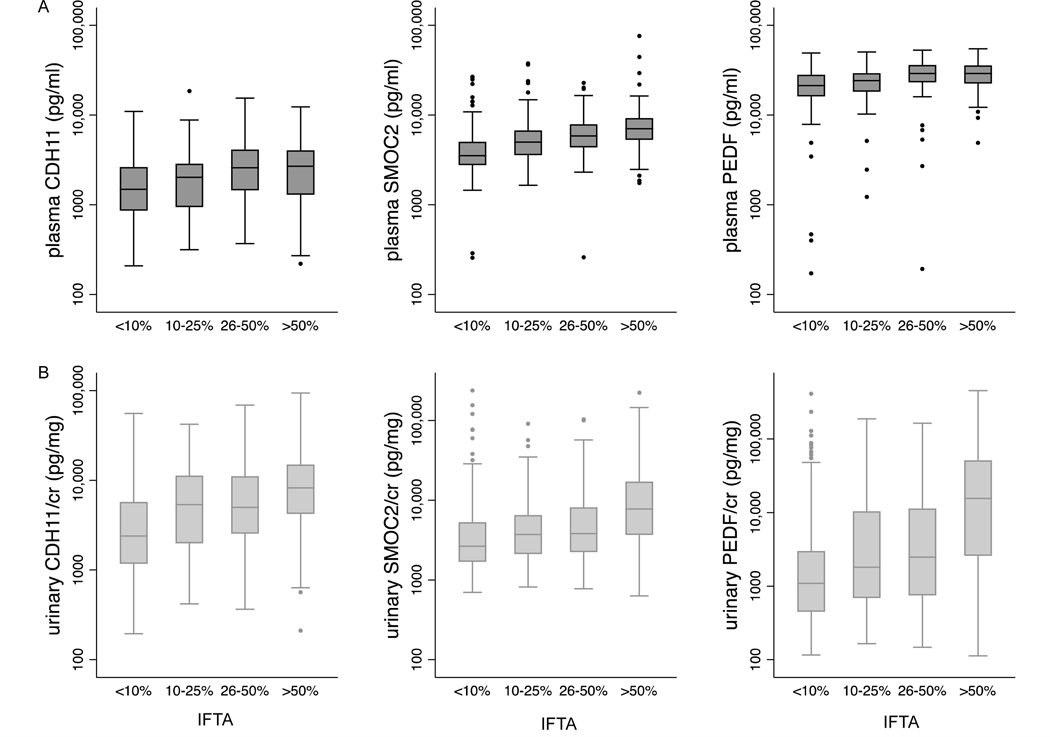
Figure 3. Differences in plasma (A) and urine (B) CDH11/cr, SMOC2/cr, and PEDF/cr levels by grades of interstitial fibrosis and tubular atrophy (IFTA) in kidney biopsy specimens.
Boxplots show median and interquartile range (IQR) of fibrosis biomarkers on a log scale. Whiskers span data within 1.5 times of the IQR of the lower and upper quartile (25th and 75th percentile, respectively). P value from Kruskal Wallis test <0.001 for each biomarker, n=438 and n=602 for plasma and urinary biomarkers/cr, respectively.

