Fig. 7.

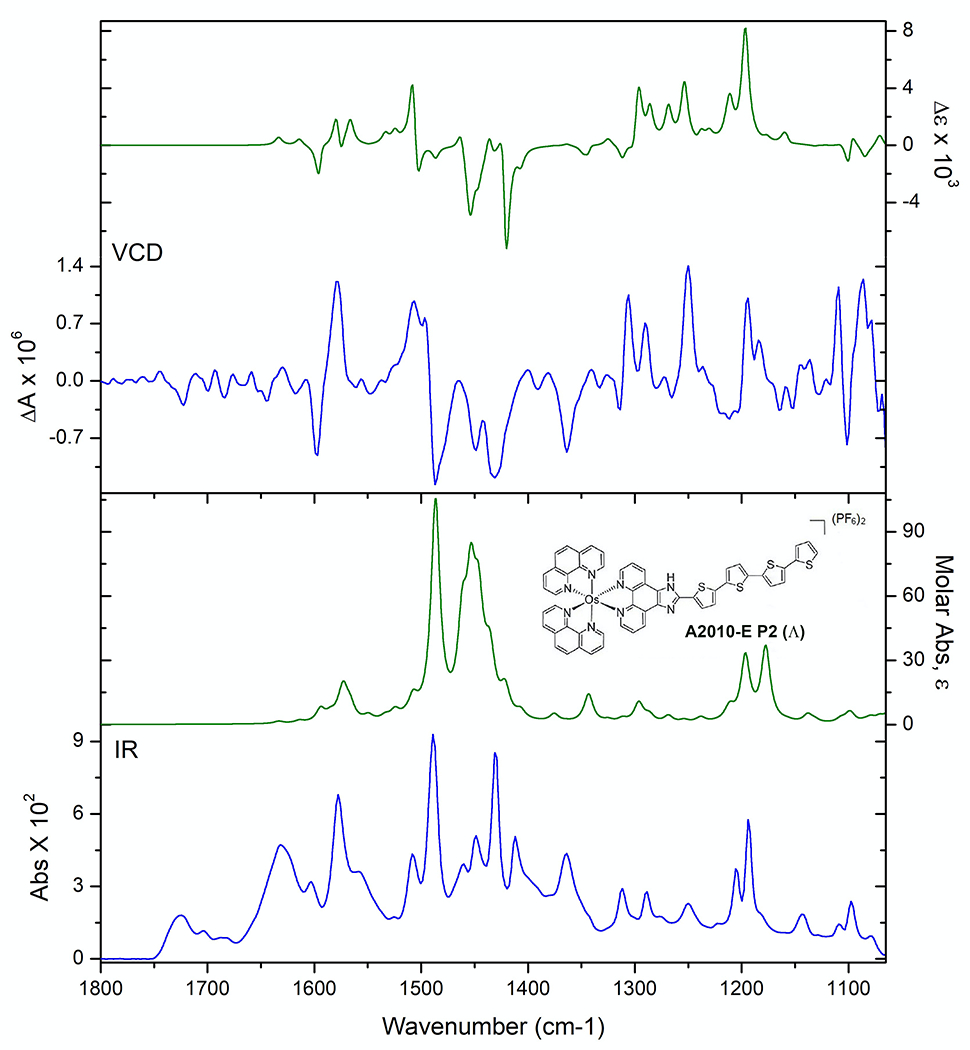
Comparison of experimental (blue lines) and theoretical DFT (green lines) IR (lower frame) VCD (upper frame) spectra for compound E. Peak 2 (left axis) compared with the spectrum of the (Ʌ) configuration (right axis).

Comparison of experimental (blue lines) and theoretical DFT (green lines) IR (lower frame) VCD (upper frame) spectra for compound E. Peak 2 (left axis) compared with the spectrum of the (Ʌ) configuration (right axis).