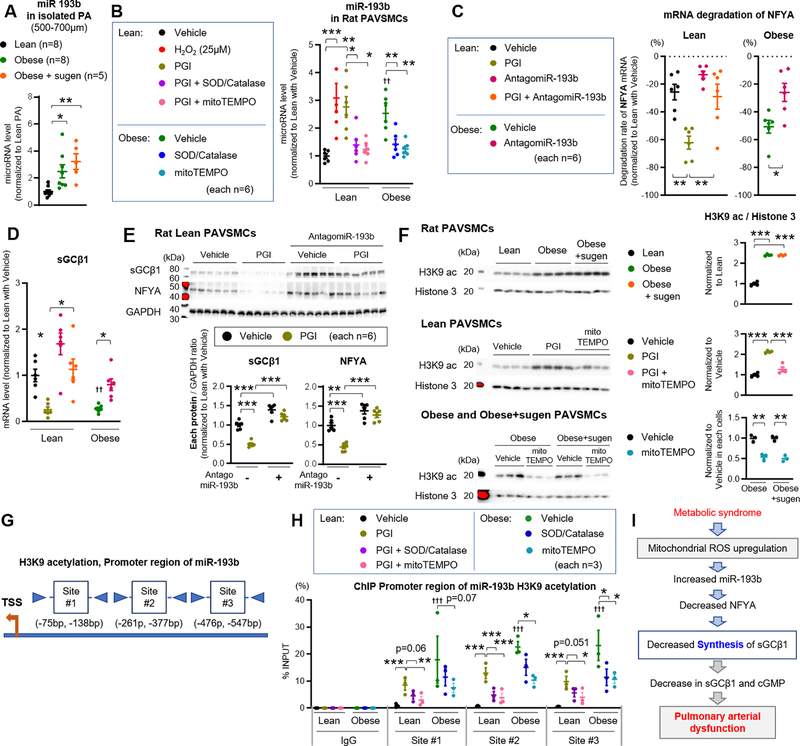
Figure 6: miR-193b promotes ROS-dependent degradation of NFYA, reducing sGC transcription.
(A) Quantification of miR-193b expression in pulmonary arteries (diameter of PAs: 500–700μm) from lean (n=8), obese (n=8), and obese+sugen rats (n=5). (B) miR-193b expression in lean and obese rat PAVSMCs treated with hydrogen peroxidase (H2O2, 25 μM), superoxide dismutase (SOD, 400 U/ml), catalase (1 kU/ml) or mitoTEMPO (50μM) (n=6). (C) mRNA degradation rate of NFYA for 24 hours in lean and obese rat PAVSMCs treated with PGI or Antagomir-193b (n=6). (D-E) Expression of sGCβ1 mRNA and protein level in lean and obese rat PAVSMCs treated with PGI or AntagomiR-193b (n=6). (F) Representative Western blot and quantification of H3K9ac and Histone 3 in lean PAVSMCs treated with PGI or mitoTEMPO or obese and obese+sugen PAVSMCs treated with mitoTEMPO (n=3–4). (G-H) Transcription binding sites for promoter region of miR-193b. Chromatin immunoprecipitation (ChIP) showing enrichment of H3K9ac at miR-193b promoter in lean and obese PAVSMCs treated with PGI, SOD, Catalase, or mitoTEMPO (each n=3). (I) Schematic representation of the molecular mechanisms underlying reactive oxygen species (ROS) and sGCβ1/NFYA/miR-193 expression, resulting in pulmonary arterial relaxation dysfunction. Results are expressed as mean±SEM. *P<0.05, **P<0.01, ***P<0.001. † P<0.05, †† P<0.01, ††† P<0.001 vs Lean PAVSMCs at same condition. Statistical analyses were performed as described in Figure 1 legend.

