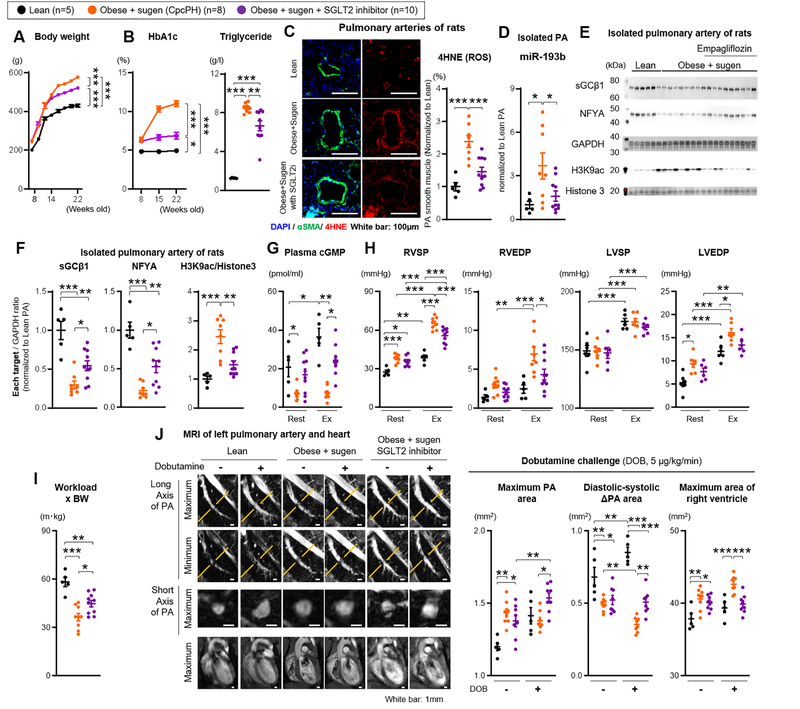
Figure 8. Upstream treatment of metabolic syndrome with SGLT2 inhibition rescues mitochondrial ROS in PAVSMCs and restores the NFYA-sGC-cGMP signaling to improve CpcPH.
Treatment with SGLT2 inhibitor (Empagliflozin 10 mg/kg/day, via drinking water) in obese rats treated with sugen (Obese+sugen). (A-B) Body weight and HbA1c level were measured from 8 to 22 weeks old. At 22 weeks old, triglyceride plasma level was measured (lean n=5, obese+sugen n=8, obese+sugen+SGLT2 inhibitor n=10). (C) Representative immunofluorescence images and quantification of 4HNE (4-hydroxynonenal), αSMA and DAPI of pulmonary arteries in lean (n=5), obese+sugen (n=8), and obese+sugen treated with SGLT2 inhibitor (n=10). (D) Quantification of miR-193b expression in pulmonary arteries from lean (n=5), obese+sugen (n=8), and obese+sugen treated with SGLT2 inhibitor (n=10). (E-F) Representative Western blot and quantification of sGCβ1, NFYA, GAPDH, H3K9 ac, and Histone 3 in isolated pulmonary arteries (diameter of PAs: 500–700μm) of lean (n=5), obese+sugen (n=8), and obese+sugen treated with SGLT2 inhibitor (n=10). (G) Quantification of plasma levels of cGMP in lean (n=5), obese+sugen (n=8), and obese+sugen treated with SGLT2 inhibitor (n=10). (H) Right ventricular systolic and end-diastolic pressure (RVSP and RVEDP), left ventricular systolic and end-diastolic blood pressure (LVSP and LVEDP) were measured at rest and during exercise (lean n=5, obese+sugen n=8, obese+sugen+SGLT2 inhibitor n=10). (I) Workload were calculated with the distance of test run (lean n=5, obese+sugen n=8, obese+sugen+SGLT2 inhibitor n=10). (J) Representative images of MRI of left pulmonary artery and heart at rest and during dobutamine (5μg/kg/min) challenge in lean, obese+sugen, and obese+sugen treated with SGLT2 inhibitor. White bars indicate 1 mm. Quantification of area of left pulmonary artery at second branch and area of RV in lean (n=5), obese+sugen (n=8), and obese+sugen treated with SGLT2 inhibitor (n=8). Results are expressed as mean±SEM. *P<0.05, **P<0.01, ***P<0.001. Statistical analyses were performed as described in Figure 1 legend.

