Fig. 3:

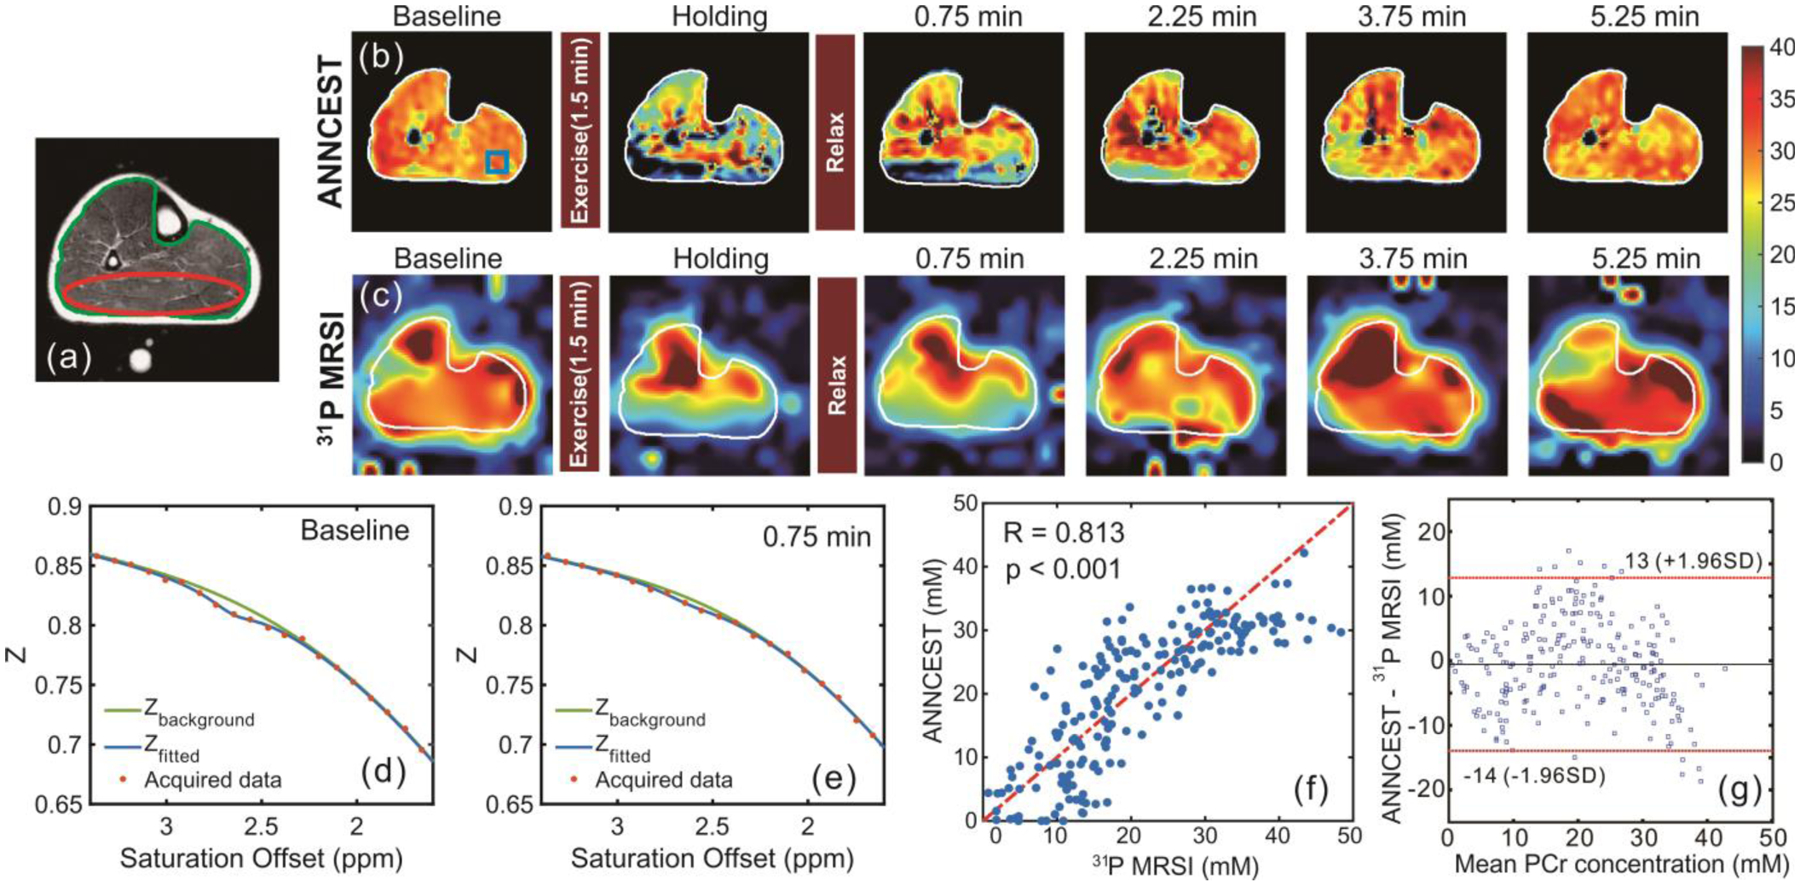
Maps of human skeletal muscle at 3 Tesla pre and post in-magnet plantar flexion exercise using PCr CEST analyzed with an artificial neural network (ANNCEST) compared with the same exercise observed using 31P spectroscopic imaging. (a) T2-weighted anatomical image. (b,c) PCr concentration maps (scale bar in mM) obtained by (b) ANNCEST and (c) 31P MRSI during the exercise process. The water saturation spectrum (Z-spectrum, in which Z is the signal during radiofrequency saturation normalized by the signal without such saturation, Z = Ssat/S0) at baseline (d) and post exercise (e) extracted from the blue rectangle region shown in (b). (f,g) Correlation and Bland-Altman analyses between concentrations obtained from ANNCEST and 31P MRSI for all four subjects (n = 202 voxels) from the red ellipse region shown in (a). Reproduced, with permission, from Chen L. et al. [72]
