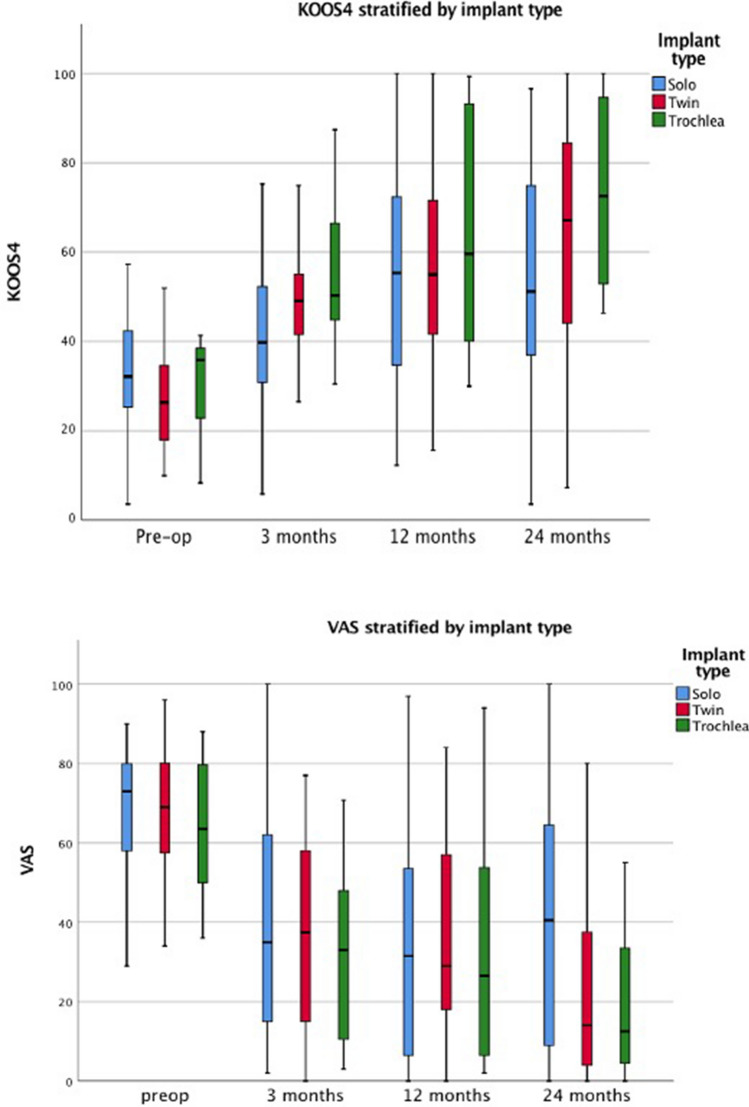
Fig. 7.
Clustered box plots showing KOOS4 and VAS pain scores categorised by implant types: condyle solo, condyle twin and trochlea at each time point (pre-operative, 3 months, 12 months, and 24 months). Values for data range on the box and whiskers are median, central distribution interquartile range and lower to upper limits. KOOS4 is calculated as the average score of the four subscale scores for Pain, Symptoms, Sport/Recreation and quality of life domains

