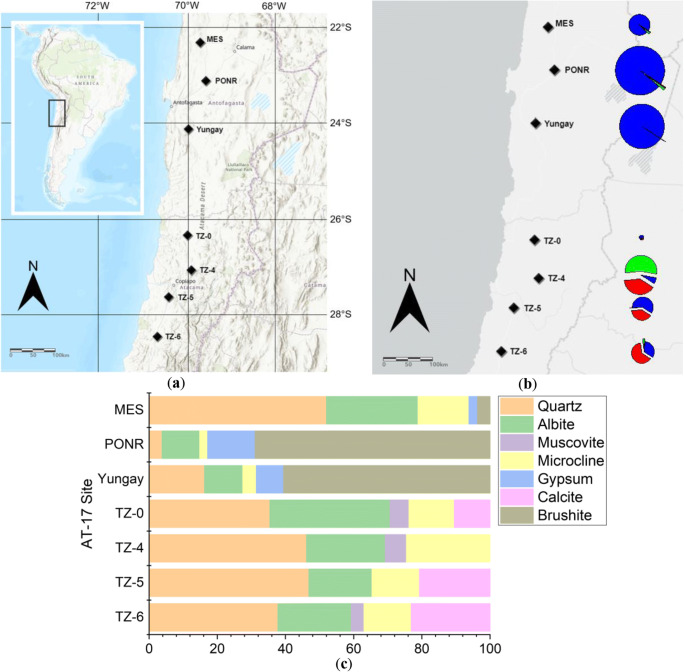
Fig. 1.
a Geographic locations of the Atacama Desert AT-17 sampling sites, including María Elena South (MES), PONR (Point of No Return), Yungay, transition zone 0 (TZ-0), TZ-4, TZ-5, and TZ-6. b Soil collection sites in the Atacama Desert, illustrating the major salt distribution of different sites. The size of the pie charts represents the concentrations of soluble salts (Cl−, red; NO3−, green; SO42−, blue). The areas of pie charts range from 30 to 17,000 ppm. c Percentages of different minerals in AT-17 samples determined by X-ray diffraction (XRD)

