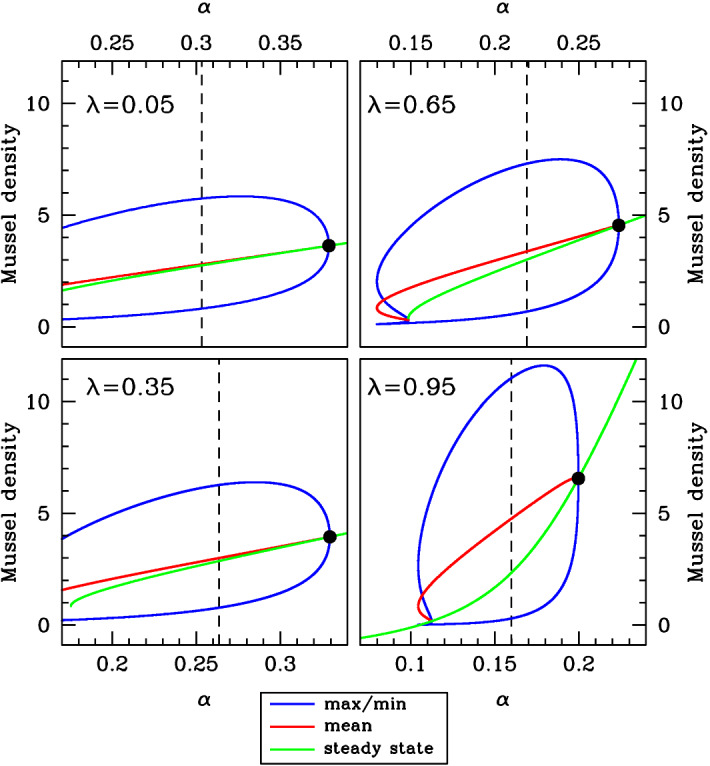
Fig. 11.

Density versus at constant wavelength. We show comparisons of the average mussel density in spatial patterns with the steady-state mussel density, when the wavelength is held constant at its value at pattern onset (the Turing–Hopf bifurcation point, indicated by ). Using the software package wavetrain (Sherratt 2012), we tracked the form of the pattern along solution branches of () as is varied with the other parameters fixed. We plot the maximum, minimum and mean (average) mussel density in the patterns and also the steady-state mussel density. As in Fig. 10, this figure shows an increasing separation between the pattern and the steady-state solution as is increased between 0 (increased production model) and 1 (decreased losses model). The dashed vertical lines indicate the values of used in Fig. 13. Note that to enable direct comparison, the same parameters are used in Figs. 9, 10, 11, 12 and 13
