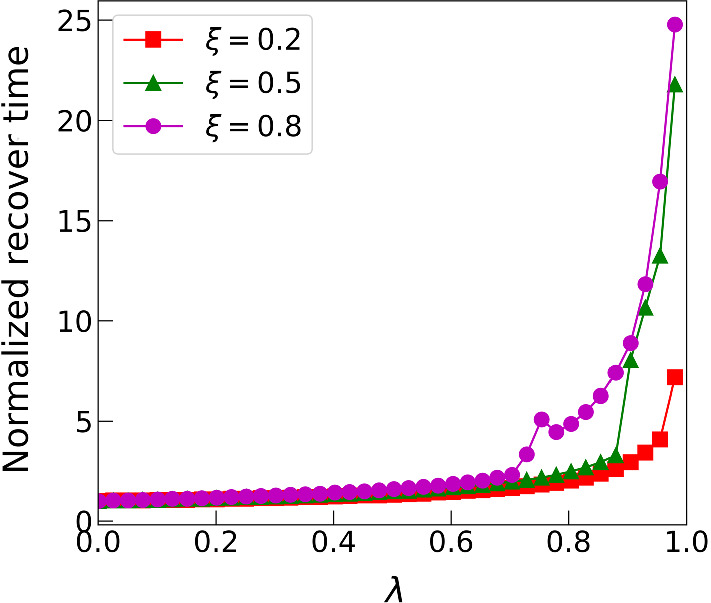
Fig. 15.

Recovery time versus . Quantitative comparison of recovery time from directional numerical simulation on model (). A spatial pattern is generated in model (); then, a single pattern period was extracted and a perturbed version of this was used as an initial condition on a spatial domain of length equal to one wavelength, with periodic boundary conditions. The perturbation consisted of a removal of 20% of the total biomass, varying randomly in space. The “recovery time” is a measure of the time taken for the solution to return to the patterned state; it is defined as the time by which solution is within 99% of the pre-perturbation pattern. We found that the details of the perturbation had a negligible effect on the recovery time. There is a clear trend for this recovery time to increase with the parameter , that is as the feedback mechanism gradually shifts from increased production to decreased losses. The parameter values are , ,
