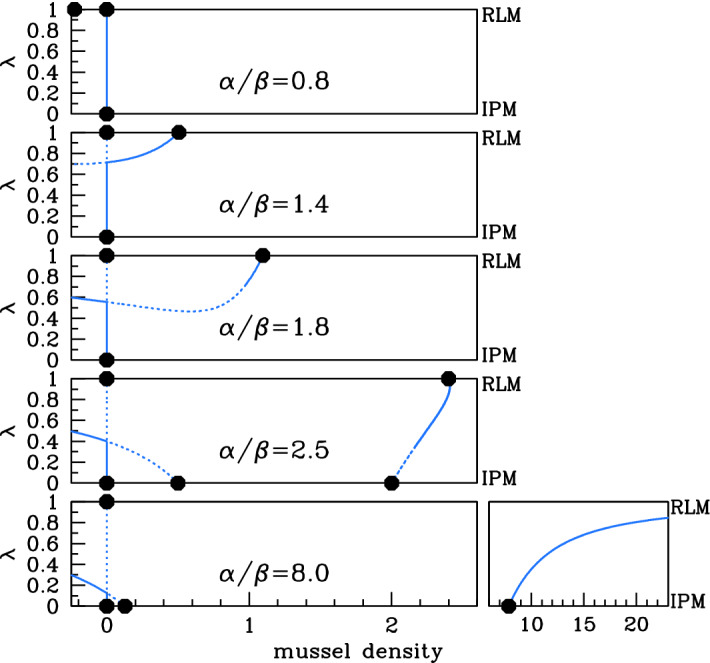
Fig. 7.

Steady states for and . We plot mussel density m against the parameter for the steady-state solutions of () when and . Solid dashed lines indicate stable unstable steady states, calculated by numerical continuation using auto (Doedel 1981; Doedel et al. 1991, 2006), with as continuation parameter. Dots indicate the steady states for the reduced losses () and increased production () models; these are plus (11), (12) and (13). The five different cases shown in the figure are separated by four critical values of : 1, , 2, and ; a full description is given in the main text. To improve clarity, the plot for is shown in two parts with different horizontal magnifications. These plots should be compared with Fig. 3, which shows the corresponding plots when : the steady states are the same but there are differences in stability for and 2.5
