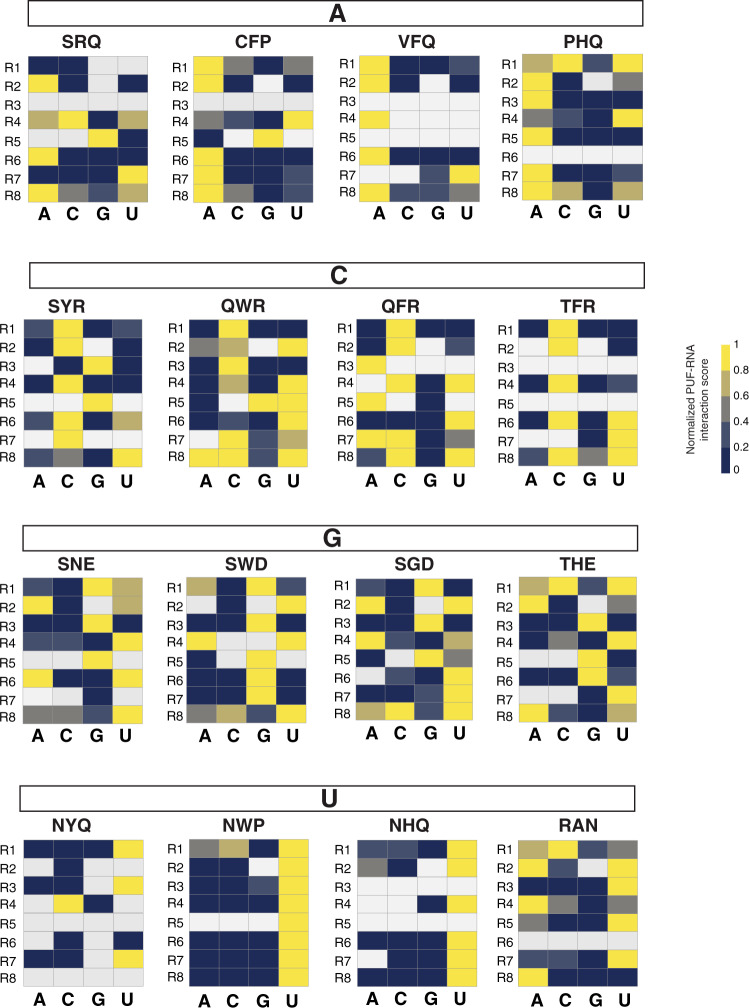
Fig. 5. Comparison of base-specific recognition patterns across repeats.
The four TRMs shown for each base are representative of TRMs with different behavior in different repeats. The heatmap shows the normalized interaction score for each base. The color intensity represents the relative interaction score normalized by the maximal value for each row. Yellow, high interaction score; dark blue, low interaction score; white, missing data. The box above each heatmap panel indicates the base that the TRM combinations prefer.

