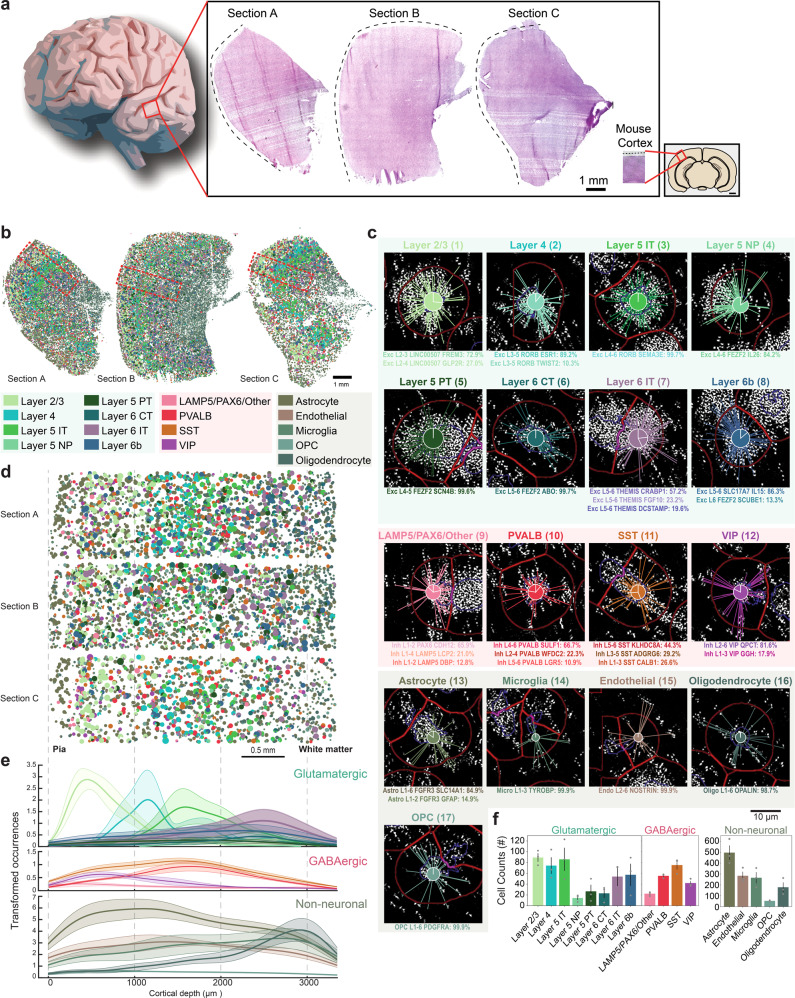
Fig. 1. Cell types of the human temporal lobe.
a Three tissue sections from the temporal lobe (Sections A–C) and the mouse visual cortex for size reference. b Spatial maps of cell types across human temporal lobe, including 24 glutamatergic, 45 GABAergic and 6 non-neuronal cells. The cells are represented as pie charts where the angle of each slice is proportional to the likelihood of the cell being of a certain type and the size of the pie chart is indicative of the number of transcripts. The colors correspond to the cell subclasses stated below the maps. Red rectangles mark the regions of interest (ROIs) in d. c Genes are assigned to cells, and cells are subsequently classified based on single-nucleus RNA-sequencing (snRNA-seq) data. Examples shown are median cells for each cell subclass, i.e. cells with the median count of the number of transcripts being assigned within each subclass. The number next to the cell subclass label denotes the cell location in Supplementary Fig. 2. The probability for each cell type is listed below the example cells. d ROIs spanning across the neocortical layers in the tissue sections in a. e Mean cortical depth profiles from the ROIs, with the transparent shades representing the standard error of the mean. Y-axis represents occurrences after smoothening data with a kernel (100 bins). Separated histograms for each cell subclass are shown in Supplementary Fig. 6. f Mean counts of each cell subclass found within the ROIs (error bars represent standard error of the mean, n = 3 tissue sections).

