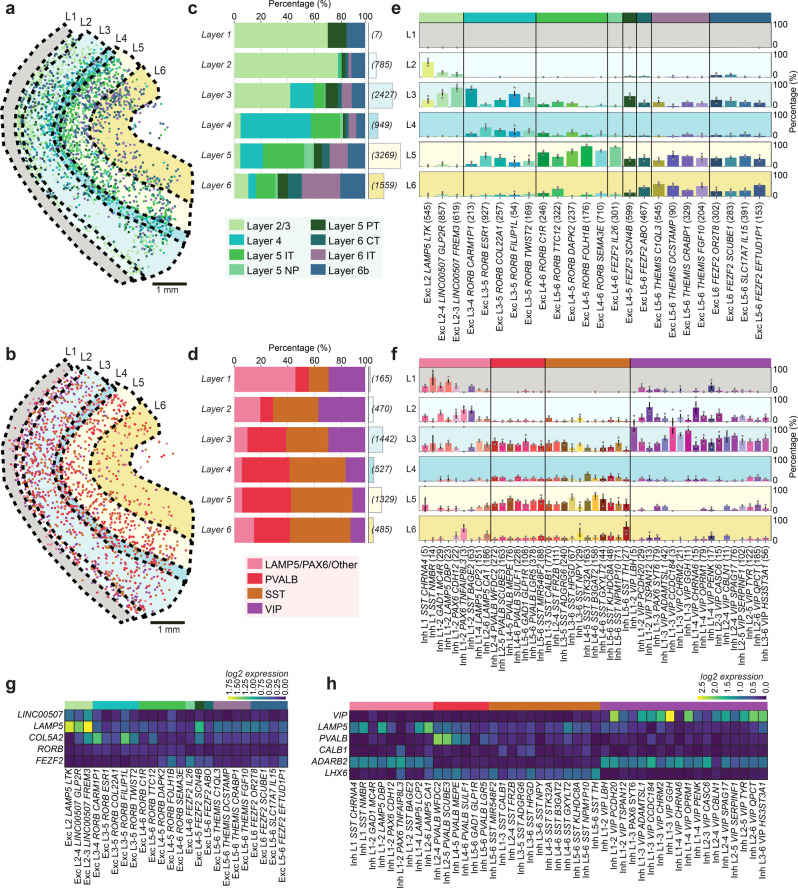
Fig. 2. Layer-specificity and molecular composition of neurons in the human temporal lobe.
a Location of glutamatergic cells colored by the most probable cell subclass and annotated neocortical layers (L1–6). b Same as in a for GABAergic cells. c The within-layer relative distribution of the glutamatergic cells and the number of cells counted for each layer in brackets. d Same as b for the GABAergic cells. e Across-layer distribution of glutamatergic cell types. The colored bars represent the relative proportion of each cell type in each layer (L1–6). Error bars represent the standard error of the mean (n = 3 tissue sections). f Same as e for GABAergic cell types. g Mean log2-transformed expression of known glutamatergic marker genes. h Same as g for GABAergic marker genes.

