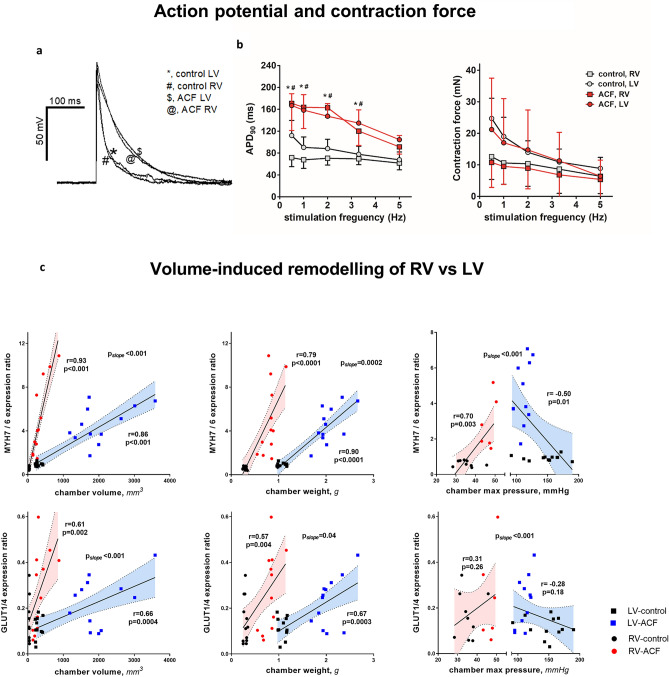
Figure 3.
Biventricular differences in contraction force, action potential duration and mRNA expression regulation in volume overload from aorto-caval fistula (ACF). (a) Example of action potential recording from isolated papillary muscle. (b left) Action potential duration at 90% repolarization (APD90) in RV and LV papillary muscles in controls and in ACF rats. Measurements at stimulation frequencies of 0.5, 1, 2, 3.3 and 5 Hz. *, p < 0.05, RV control vs. RV ACF; #, p < 0.05, LV control vs. LV ACF (3-way ANOVA). (b right) Maximal contraction force in RV and LV papillary muscles in control and ACF rats. (c) Relation of hypertrophy determinants to gene mRNA expression patterns in RV and LV. Note discordant relations between gene expression and ventricular pressures; concordant but steeper relation of RV compared to LV. r: Pearson´s correlation coefficient, p: p-value of correlation. The line represents linear regression with 95% confidence bands. pslope denotes the difference between regression slopes.

