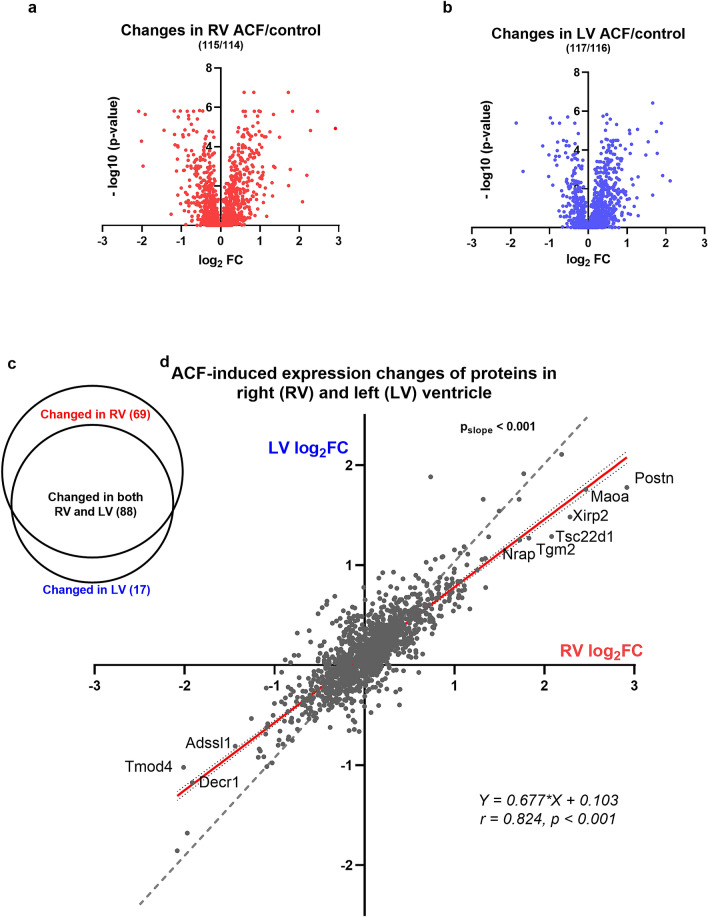
Figure 4.
iTRAQ proteomic analysis of biventricular response to volume overload due to ACF. (a, b) Vulcan plot of identified proteins in RV and LV. X axis represents log2 of fold change compared to controls, Y axis -log10 of p-value. (c) Venn diagrams of differentially regulated proteins in ACF compared to controls (significant difference with threshold > 1.5-fold). (d) ACF-induced changes (log2 of fold-) in RV (X axis) vs LV (Y axis). Note departure of the regression line (with 95% CI, red) from identity line (dashed), towards RV. The proteins with relatively highest differential regulation in RV are labeled in red. For abbreviations, see text.

