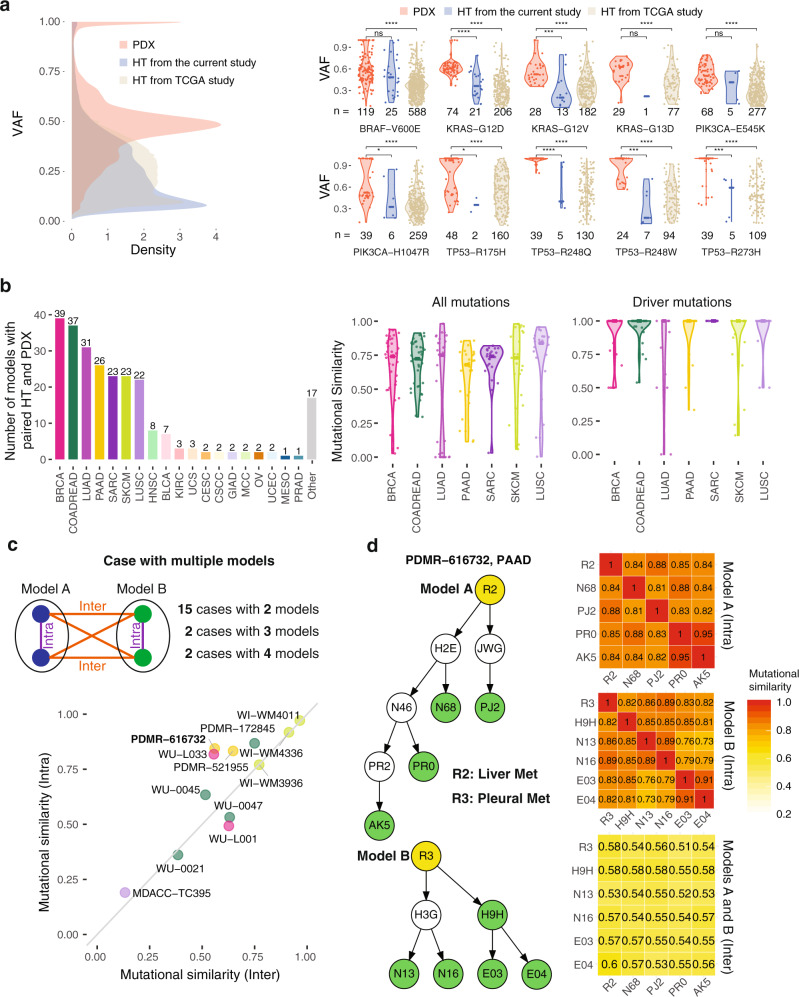
Fig. 2. The landscape of somatic mutations in human tumors and PDXs.
a Comparison of variant allele frequency (VAFs) for mutations between PDX and TCGA data. Number of samples (n) for each group is shown in the figure. b Number of patients with both human and PDX samples and the similarity of somatic mutations between them across different cancer types. c Mutational similarity among samples from different PDX models. d Schematics of tree plots of two PDX models from example case PDMR-616732 and the heatmap matrix of intra- and inter-mutational similarity. The mutational similarity quantifies the percentage of overlapping mutations between two samples. In a., we use two-sided Wilcoxon rank-sum test for calculating p values, where *, **, ***, and **** stand for p-value < 0.05, < 0.01, < 0.001, and < 0.0001 respectively. Source data are provided as a Source Data file.

