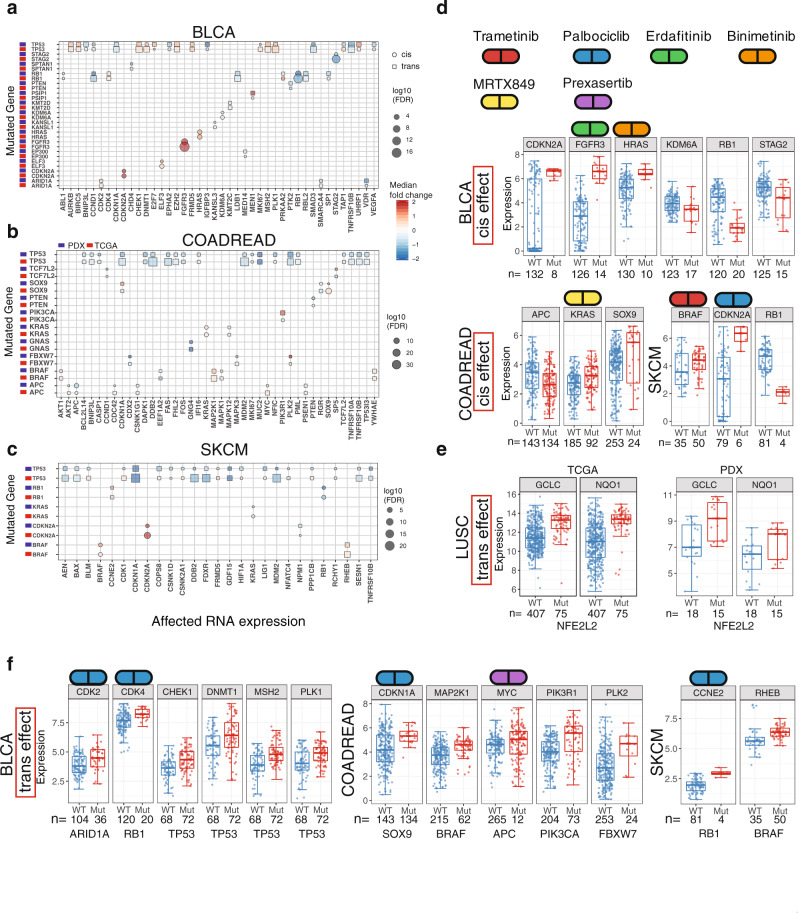
Fig. 3. Cis and trans effect of driver mutations on gene expression.
a–c Cis and trans effect of driver mutations on RNA expression from TCGA tumors and PDXs on three different cancer types: bladder (BLCA), colorectal (COADREAD), and skin cutaneous melanoma (SKCM). Boxplots for the cis effect (d) and trans effect (e, f) of key driver genes on gene expression. Number of samples (n) for each group is shown in the figure. The box boundary of each box plot indicates third quartile and first quartile respectively from the top to bottom. The whisker on top were drawn out from the third quartile to the largest data point or up to 1.5 × IQR. Similarly, the bottom whisker extends from the first quartile down to 1.5 × IQR or the lowest data point. The red dot at the center indicates medium. Source data are provided as a Source Data file.

