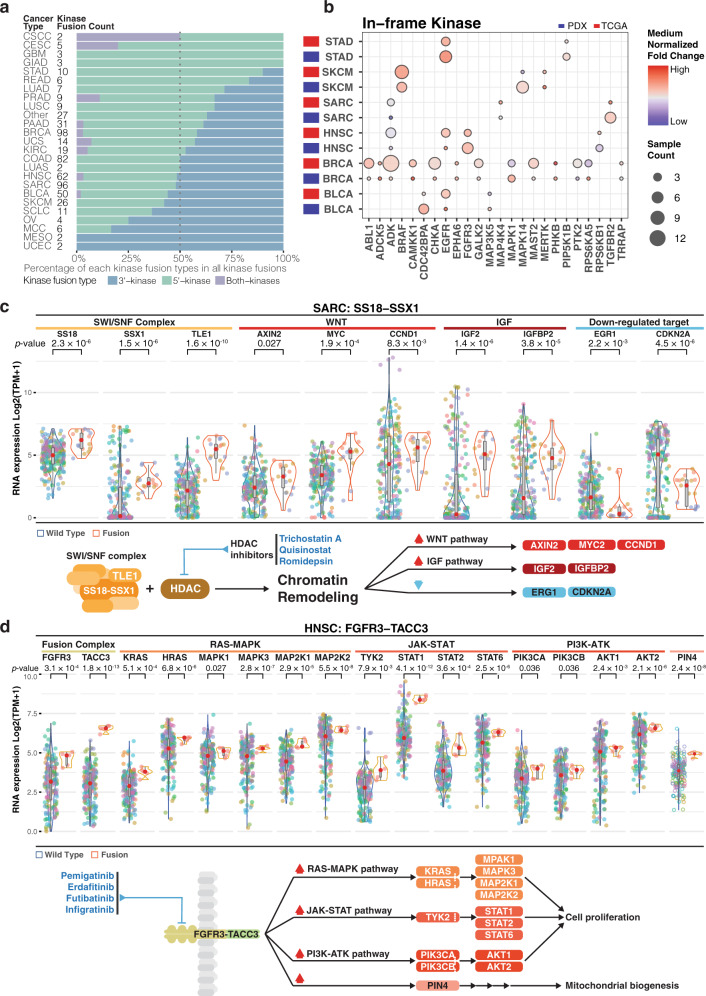
Fig. 4. Fusion events in pan-cancer.
a Distribution of kinase fusion type based on kinase location (5′, 3′ and both kinases fusion) per cancer type (Fusion count: kinase fusion events detected in each PDX model. Kinase fusion percentage: kinase fusion count/total detected fusions). b Median normalized expression of fusion involving kinase per cancer type. Fusion in greater than 2 PDX samples while overlap with TCGA events are shown (Sample count: independent PDX sample). c, d Expression of genes in fusions and those significantly altered (Wilcoxon test, p < 0.05) in the downstream pathways for respectively (c) SS18-SSX1 in sarcoma (SARC) and (d) FGFR3-TACC3 in head and neck squamous cell carcinoma (HNSC). The diagram below illustrates the simplified mechanism and pathway for given fusion. Potential treatment intervention labeled in blue texts. Dot color indicates samples from the same patient case. The diagram below illustrates the simplified mechanism and pathway for given fusion. Potential treatment intervention labeled in blue texts. The box boundary of each box plot indicates third quartile and first quartile respectively from the top to bottom. The whisker on top were drawn out from the third quartile to the largest data point or up to 1.5 × IQR. Similarly, the bottom whisker extends from the first quartile down to 1.5 × IQR or the lowest data point. The red dot at the center indicates medium. P-values were calculated using two-sided Wilcoxon rank-sum tests. Source data are provided as a Source Data file.

