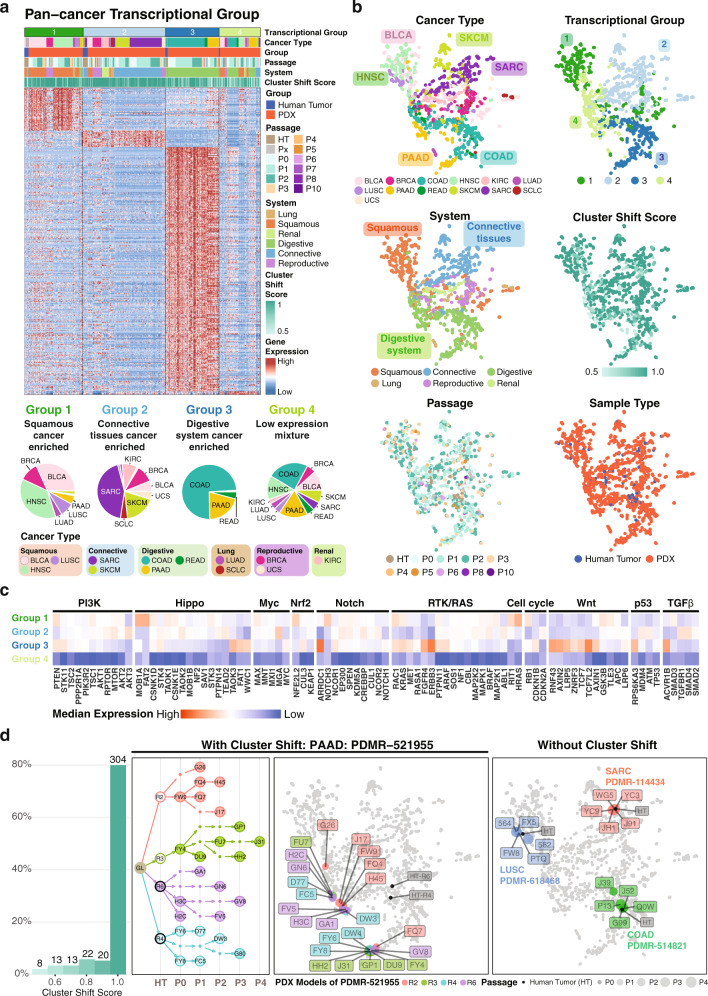
Fig. 5. Pan-cancer transcriptional groups.
a Top panel is four major pan-cancer transcriptional groups (limegreen, skyblue, oceanblue, and light olive) identified from the expression of significant positive differentially expressed genes (FDR > 0.05, fold change > 1) of each transcriptional group in cancer types with sample size greater than 20. Those include Bladder Urothelial Carcinoma (BLCA), Breast invasive carcinoma (BRCA), Colon adenocarcinoma (COAD), Head and Neck squamous cell carcinoma (HNSC), Kidney renal clear cell carcinoma (KIRC), Lung adenocarcinoma (LUAD), Lung squamous cell carcinoma (LUSC), Pancreatic adenocarcinoma (PAAD), Rectum adenocarcinoma (READ), Sarcoma (SARC), Small cell lung cancer (SCLC), Skin Cutaneous Melanoma (SKCM), Uterine Carcinosarcoma (UCS). The heatmap shows differentially expressed genes (DEGs) from each group. Bottom panel is the ratio of each cancer type in each transcriptional group. b Dimension reduction UMAP 2D-plots using 1000 most variable genes. Each point represents one sample. Colors in each panel indicate respectively cancer type, transcriptional group, system, cluster shift score, passage, and sample type of each sample. c Normalized medium expression of genes in major oncogenic pathways. d First panel is the distribution of cluster shift score. Second and third panel are the pedigree tree and the 2D distribution of case PMDR-521955. Each color (light coral, yellow green, purple, and light teal) indicates one PDX model originated from the same hurman tumor sample. In the second panel, filled circles are human samples with RNA-Seq data. Hollow circle and dot are human and PDX sample without data. Fourth panel is an example of PDX models without cluster shift. Each color (red, blue, and green) indicates samples from one PDX model. Source data are provided as a Source Data file.

