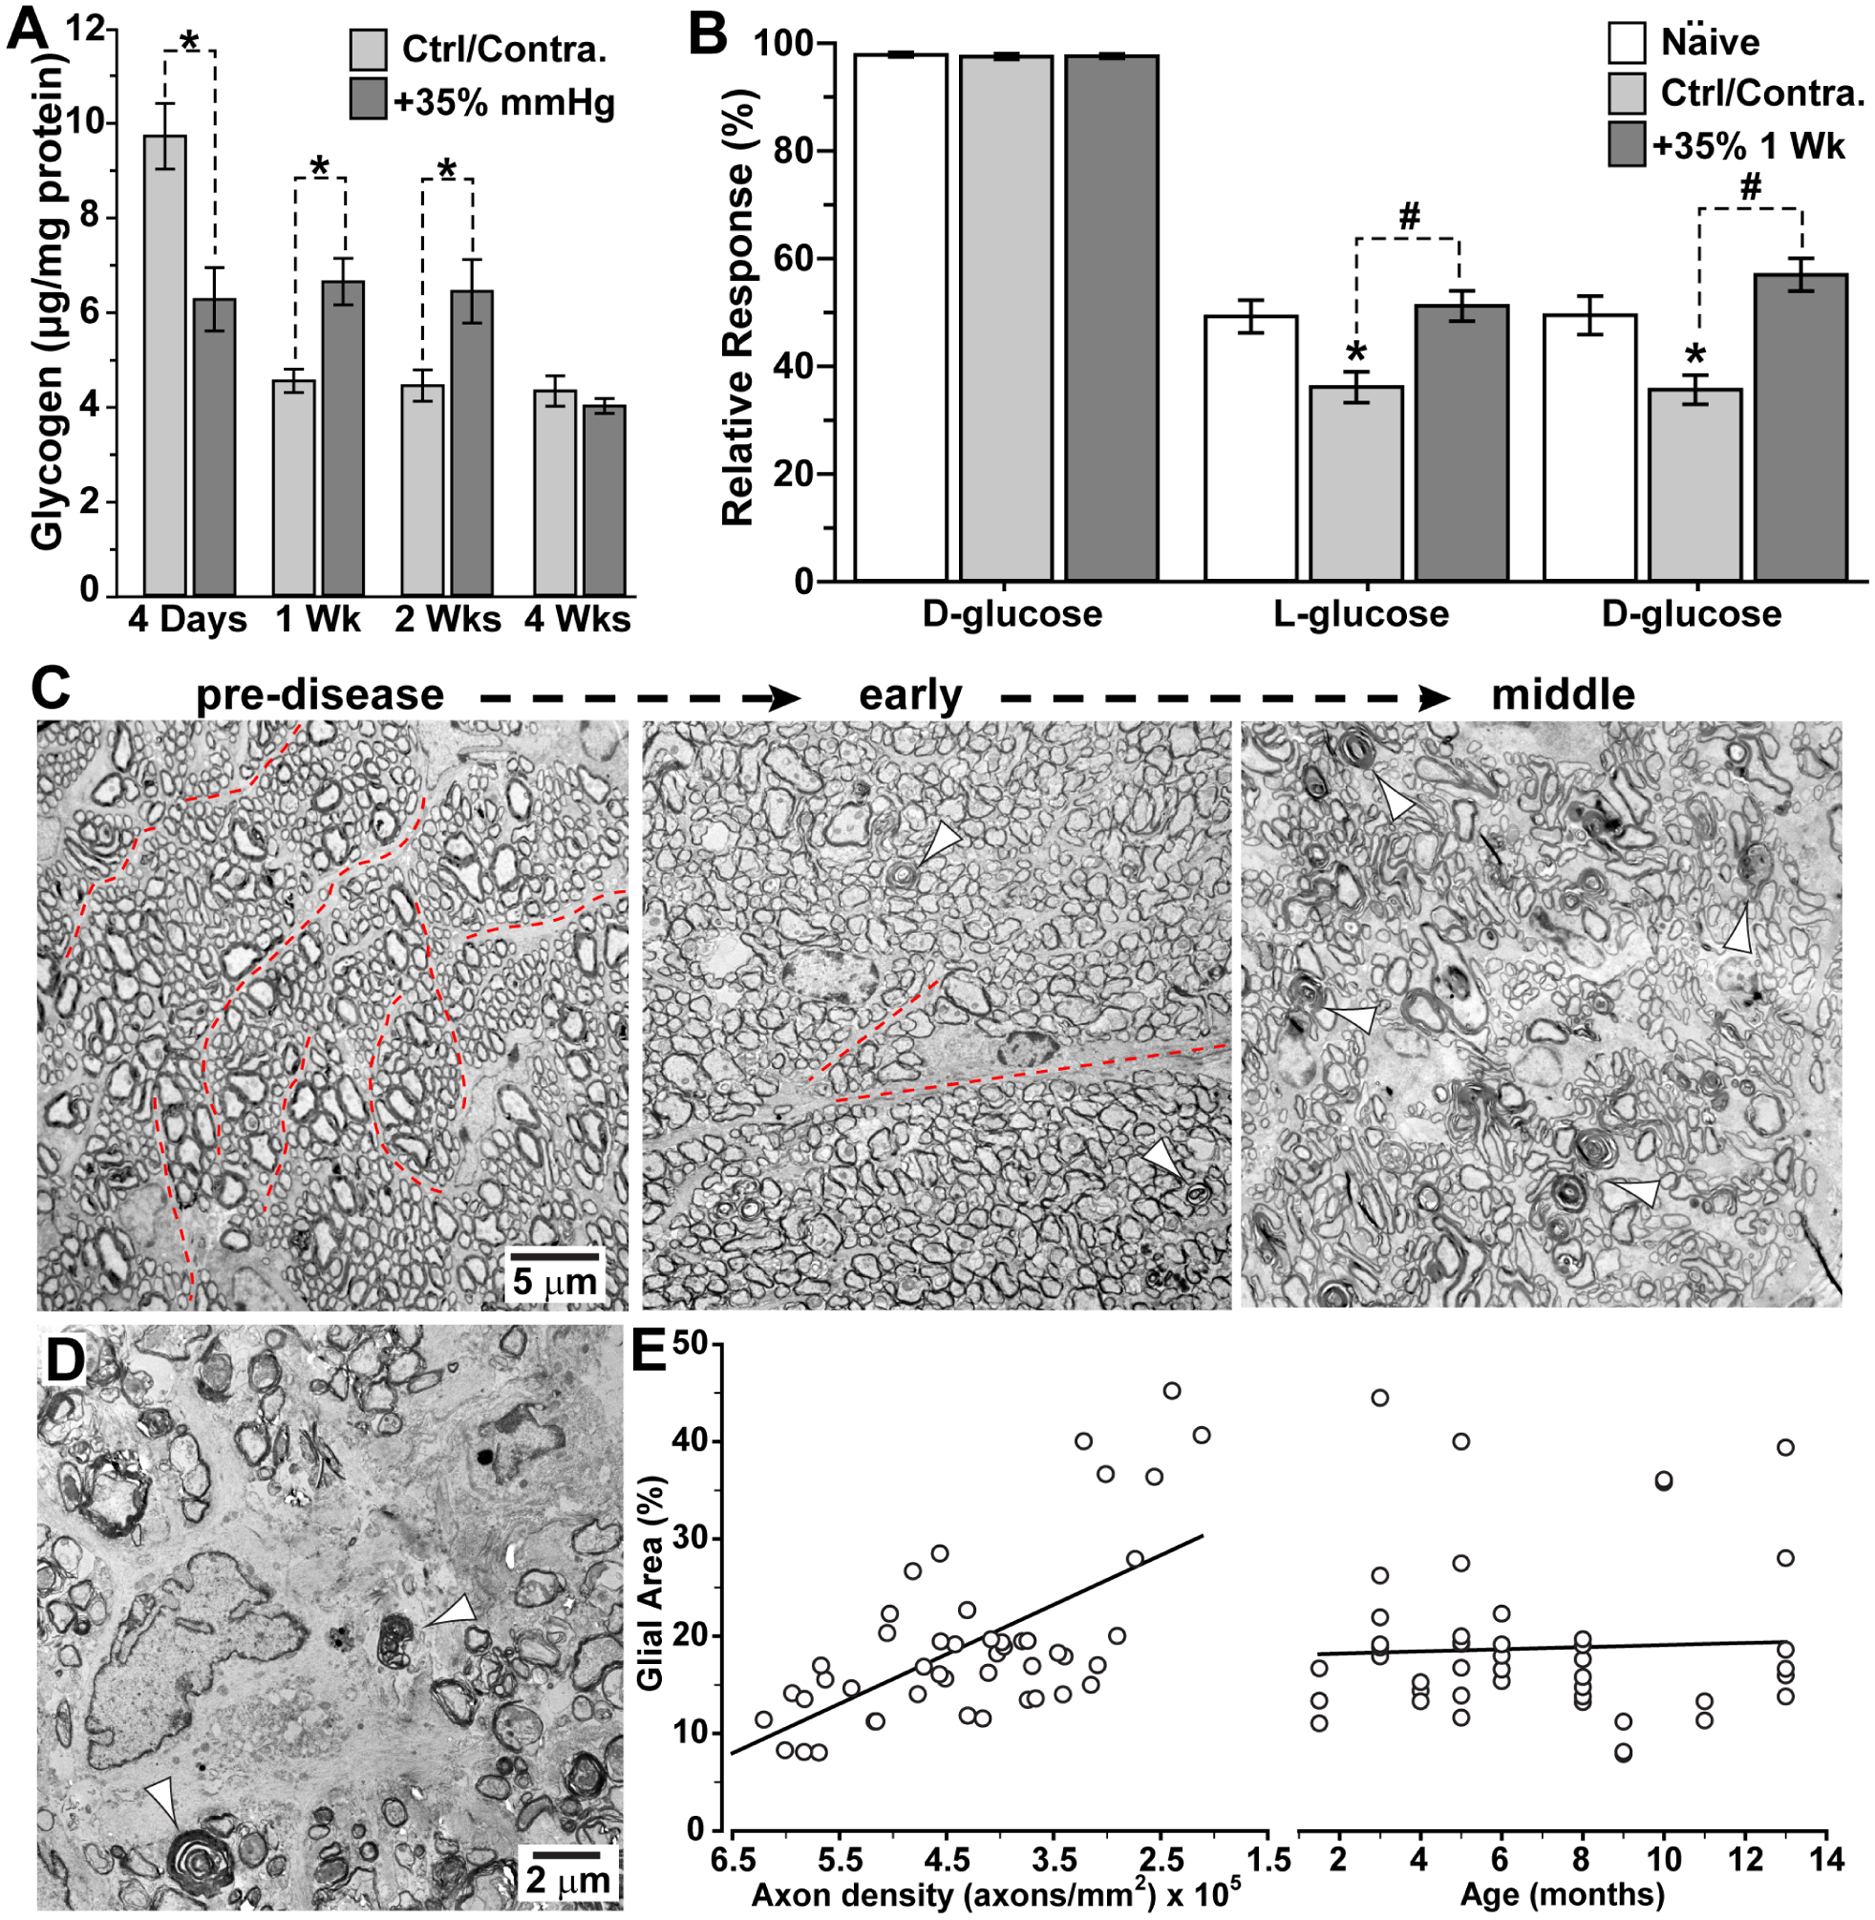
Figure 6. Astrocyte metabolism and remodeling in the optic nerve.

A. In C57 mice, microbead-induced elevations in IOP (+35%) initially diminish astrocyte-stored glycogen in the optic nerve compared to the control/contralateral control nerve; after one and two weeks, glycogen in the stressed nerve increases at the expense of the control nerve (*, p ≤ 0.05). By four weeks, glycogen equilibrates between the nerves. B. As a result of glycogen imbalance, compound action potential of C57 optic nerve following one week of elevated IOP responds stronger during and recovers faster from D-glucose deprivation than control/contralateral control nerve (#, p<0.001); control nerve also response more weakly than naïve nerve (*, p ≤ 0.002). C. Electron micrographs of cross-sections through DBA/2J optic nerve demonstrate intact axon fascicles bound by thin astrocyte processes (dotted lines) prior to progression (left). In the early stages, axons enlarge, and astrocyte processes withdraw with sparse examples of degenerating profiles (arrowheads). As progression continues (right), fascicles become disorganized as degeneration accelerates. D. In final stages, DBA/2J nerve demonstrates abundant degenerating profiles (arrowheads) as astrocyte hypertrophy predominates over intact axons. E. The density of intact RGC axons determines the extent of astrocyte hypertrophy in the DBA/2J more so than age (r2=0.42; p<0.001). A, B: modified from Cooper et al. (2020). C,D: see also Cooper et al., 2016; 2018.
