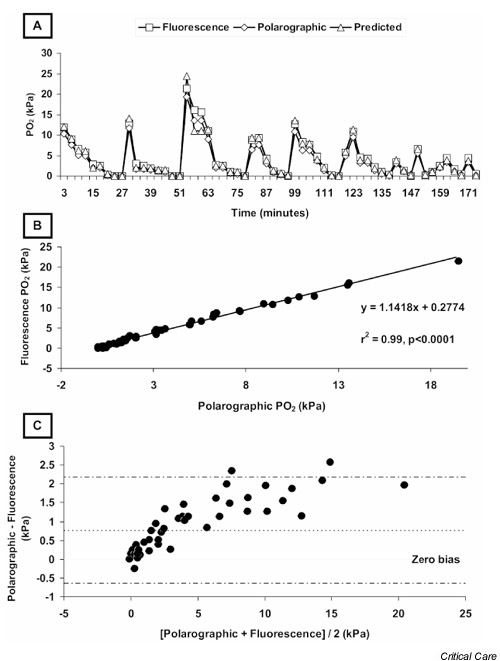
Figure 1.

(A) Plot of fluorescence, polarographic and predicted partial oxygen tension (PO2) against time. (B) Correlation plot of polarographic and fluorescence measurement techniques. (C) Bland–Altman plot of polarographic and fluorescence techniques demonstrating proportional bias arising from one (or both) of the techniques.
