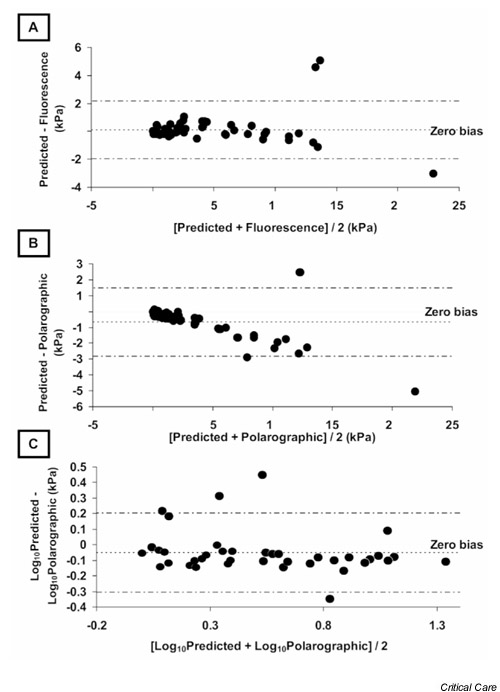
Figure 2.

(A) Bland–Altman plot of fluorescence technique and predicted partial oxygen tension (PO2), demonstrating close limits of agreement and no systematic or proportional bias over the measurement range. (B) Bland–Altman plot of polarographic technique and predicted PO2 demonstrating clear proportional bias, which corrects with logarithmic transformation of the data (C).
