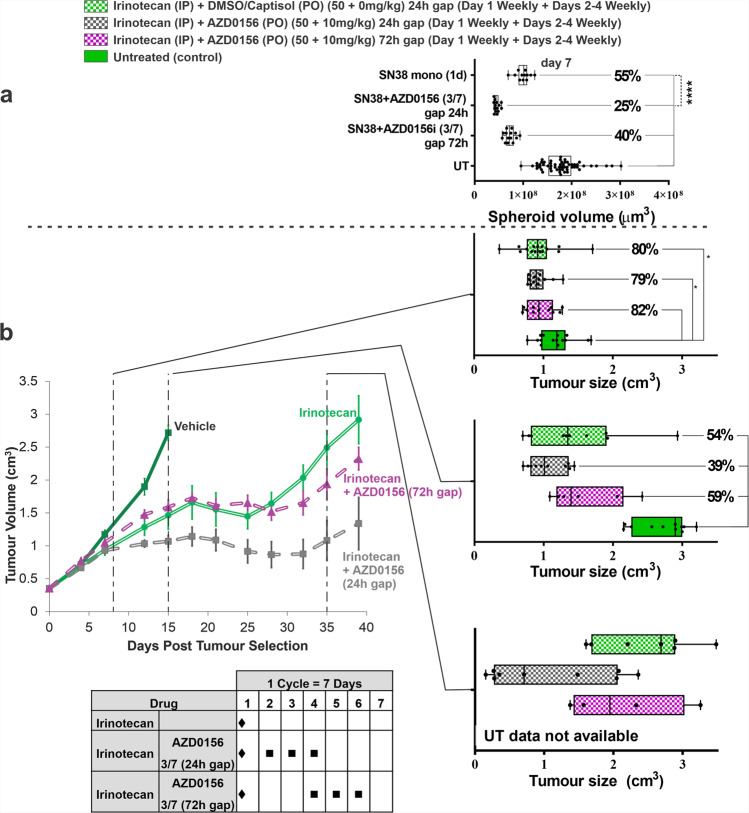
Fig. 5. Comparison of SW620 tumour cells response to different schedules of topoisomerase-I inhibitor and AZD0156 in the microfluidic Ibidi chip versus mouse in vivo study.
SW620 tumour spheroids were treated with SN38 and two different gapped schedules with the ATM inhibitor in Ibidi microfluidic chip using 8-concentration profile over 24 h (Table 1), spheroids volumes were evaluated at day 7 of post-treatment. N ≥ 5 per condition from two independent experiments. Box-plots show median (centre line); box limits are 25th to 75th percentile; whiskers represent min and max values (a); SW620 tumour xenografts were subcutaneously implanted in mice (N = 15 per group) and subjected to the same treatment schedules as the spheroids in Ibidi chip. Tumour volume was measured regularly over 40 days. The graph represents mean ± SE. Tumour volumes at days 7, 15 and 35 were plotted as box-and-whisker graphs for easier comparison with in vitro microfluidic data (median—centre line; box limits—25th to 75th percentile; whiskers—min and max values) (b). Statistical analysis was carried out using 1-way ANOVA, Tukey’s multiple comparisons, CI = 95%, ****p < 0.0001; ***p < 0.001; **p < 0.01; *p < 0.1.

