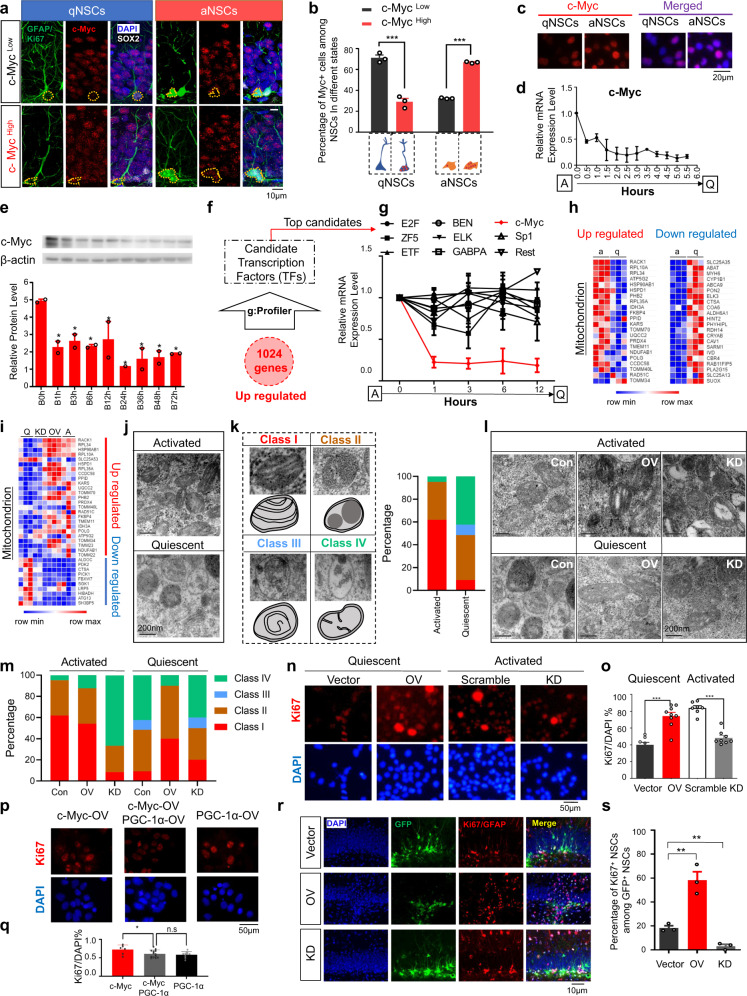
Fig. 1.
c-Myc regulates neural stem cell quiescence and activation by coordinating the cell cycle and mitochondrial remodeling. a Confirmation of c-Myc expression (red) in the NSC and progenitor compartments by co-staining with GFAP (green)/Sox2 (white)/Ki67 (green) and DAPI (blue). qNSCs: GFAP+/Sox2+/Ki67− and aNSCs: GFAP−/Sox2+/Ki67+. b Differential expression of c-Myc in qNSCs and aNSCs. qNSCs were predominantly c-Myc low cells (71% ± 5%) (n = 3), and aNSCs were mostly c-Myc high cells (67% ± 1%) (n = 3). c c-Myc expression dynamics in NSCs in vitro. Left: c-Myc staining in qNSCs and aNSCs; Right: c-Myc staining merged with DAPI. d RT-qPCR analysis showed rapid repression of c-Myc transcription occurred immediately (6 h) upon quiescence induction (n = 3). Half an hour after quiescence induction, c-Myc transcripts already decreased by 2-fold and at 1.5 to 6 h, had decreased by 3- to 10-fold. e Western blot analysis showed decreasing c-Myc protein level during the transition to quiescence. f Schematic of the transcription factor binding motif enrichment analysis of the promoters from upregulated (1024) genes. g Expression dynamics of the top enriched transcription factors in NSCs upon quiescence induction, determined by RT-qPCR analysis (n = 3). For each gene, its expression value at the first timepoint was used as the normalizing control for its own series. h Expression patterns of mitochondrial genes in aNSCs v qNSCs. i Expression patterns of mitochondrial genes in aNSCs (A), c-Myc KD aNSCs (KD), qNSCs (Q), and c-Myc OV qNSCs (OV). j Morphological and size changes of mitochondria in aNSCs and qNSCs determined by TEM. k Classification of mitochondria by the status of cristae and distribution of different types of mitochondria in aNSCs and qNSCs. l c-Myc overexpression and knockdown altered mitochondrial morphology and size. m Distribution of different types of mitochondria with c-Myc overexpression and knockdown. n Ki67 (red) and DAPI (blue) staining in aNSCs and qNSCs transfected with vector (n = 8 fields), c-Myc OV (n = 9 fields), scramble (n = 7 fields), and c-Myc KD (n = 8 fields). o Increased proliferation with c-Myc-OV qNSCs (n = 9 fields) and decreased proliferation with c-Myc KD aNSCs (n = 8 fields) as determined by Ki67 staining. p Ki67 (red) and DAPI (blue) staining in NSCs with PGC-1α overexpression. q Ablation of the c-Myc-mediated increase in proliferation by the mitochondrial biogenesis regulator PGC-1α (n = 6, 10, and 13 fields). r Co-staining of GFP (green), Ki67 (red), Sox2 (white), and DAPI (blue). s Lentivirus-mediated c-Myc OV drastically increased but c-Myc KD drastically decreased hippocampal NSC proliferation in vivo (n = 3). All data are presented as the mean ± SEM values. An unpaired t-test was used to analyse the difference between the two groups. *P < 0.05; **P < 0.01; ***P < 0.002; n.s, no significance

