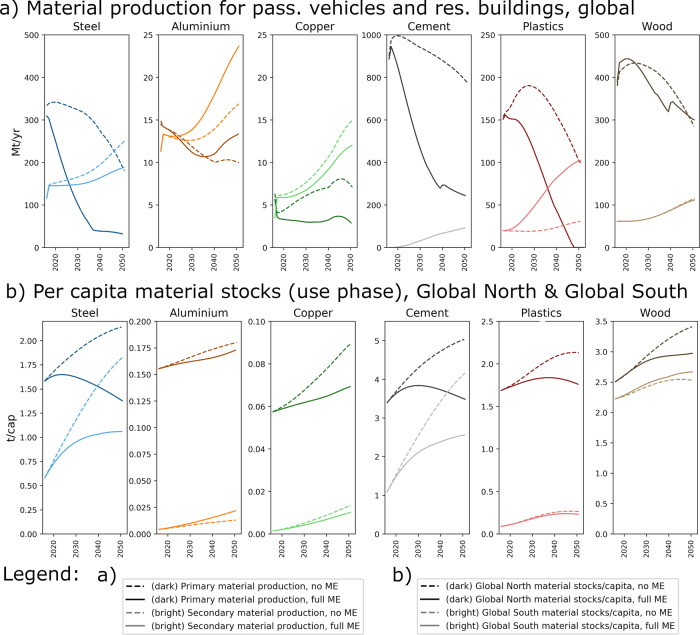
Fig. 4. Impact of material efficiency on material production.
a Global material production 2016–2050 (primary = from virgin resources, secondary = from post-consumer scrap) for six major materials in SSP1 and a 2 °C policy mix, for passenger vehicles and residential buildings, and for scenarios with no and those with full material efficiency (ME). b Per-capita in-use stocks (2016–2050) of materials in passenger vehicles and residential buildings, Global North, and Global South average. The unit for part a is megatons per year (Mt/yr) and for part b it is ton per capita (t/cap).

