Figure 3.
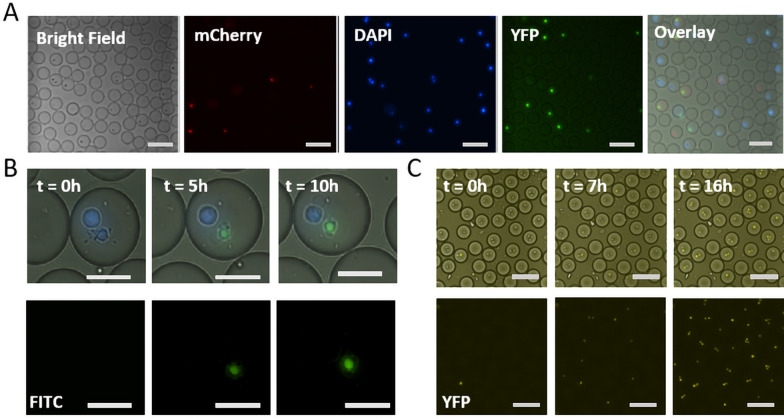
Real-time viability tracking. NK cells and target cells (here K562 cells and Jurkat T cells) were labelled with Calcein Red AM (5 µM) and Cell Tracker Blue (10 µM), respectively. The viability dyes Sytox Green (2.5 µM) and Cell Event Caspase 3/7 (7 µM) were encapsulated in droplets with cells and culture medium. (A) Image showing different cells in droplets that are monitored using mCherry for NK cells, DAPI for K562 cells, and YFP/FITC for dead cells; scale bar = 100 μm. (B) K562 cells were labelled with Cell Tracker Blue (25 µM) and co-encapsulated with Sytox Green as viability marker. The signal remains stable over 10 h; scale bars = 25 μm (C) Jurkat T cells were encapsulated in droplets along with (Cell Event Caspase3/7 (7 μM) and 5% DMSO to induce apoptosis. In presence of DMSO, the cell undergoes apoptosis after 6 h, and the staining remains stable over 10 h; scale bars = 100 μm.

