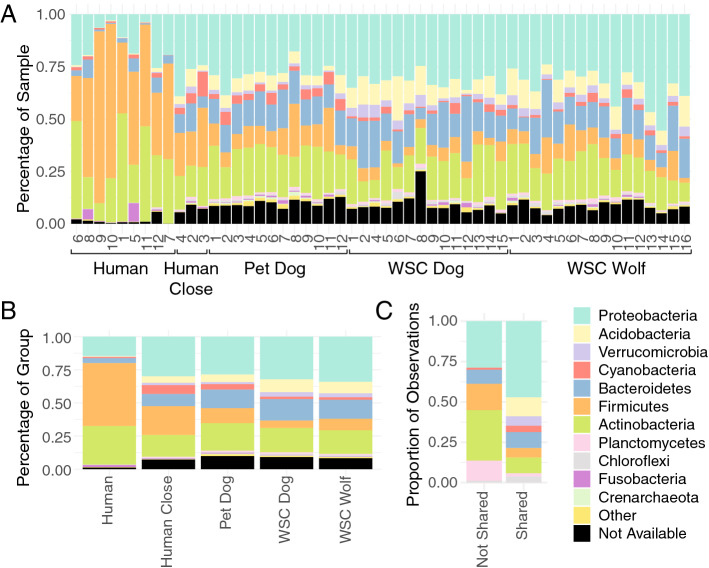
Figure 4.
Phylum level taxonomic distributions. (A) Each individual sample comparison ordered by group. Humans are additionally ordered by level of animal contact, as classified based on the tSNE plots (Fig. 2). (B) Average distribution across groups, including humans with close contact. (C) Proportion of ASVs that are exclusively observed more than 200 times in only non-close contact Humans (not shared) or in both close contact Humans and Pet Dogs (shared).

