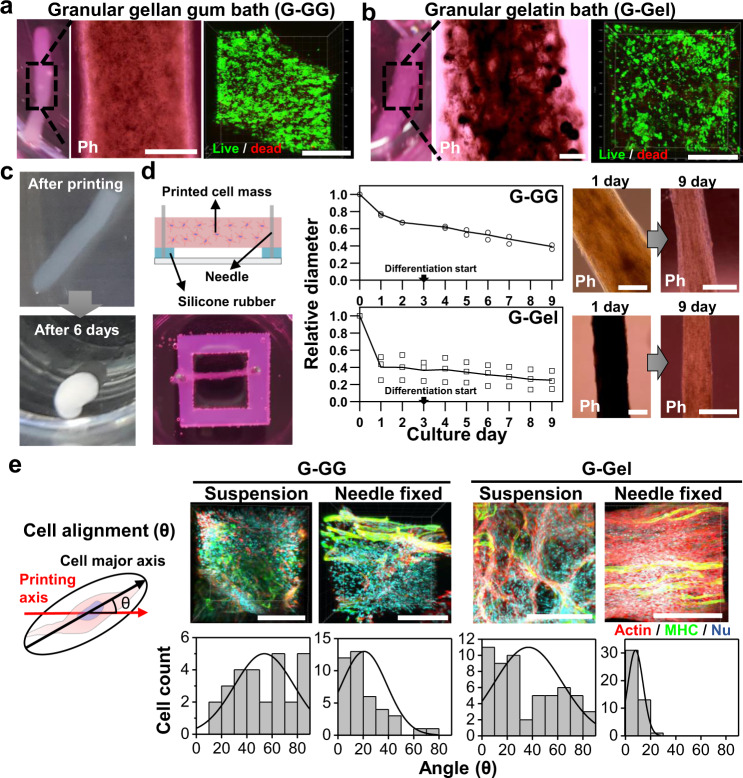
Fig. 3. The characterization of bSC tissue fabricated by SBP.
a, b Optical (left), phase contrast (middle), and fluorescence (right, green: live cells and red: dead cells) images of the bSC tissues printed inside granular gellan gum (G-GG) (a) and granular gelatin (G-Gel) (b) followed by bath removal. Scale bars, 500 µm. c Shape change of bSC tissue fabricated by SBP inside G-Gel from the fibrous form right after printing and bath removal to globular form on day 6 of suspension culture. d Schematic (left), size change in accordance with culture day (middle), and phase-contrast images (right) of needle fixed culture of printed bSCs tissues. Error bars represent mean ± s.d. Scale bars, 500 µm. e 3D-fluorescence images (upper, red: actin and green: MHC) and cell alignment measurements (lower) of the bSC tissues printed inside G-GG and G-Gel and in suspension and needle-fixed cultures on day 3 of differentiation (after six days), respectively. Representative images from at least two independent experiments are shown. Scale bars, 200 µm. Source data are provided as a Source Data file.

