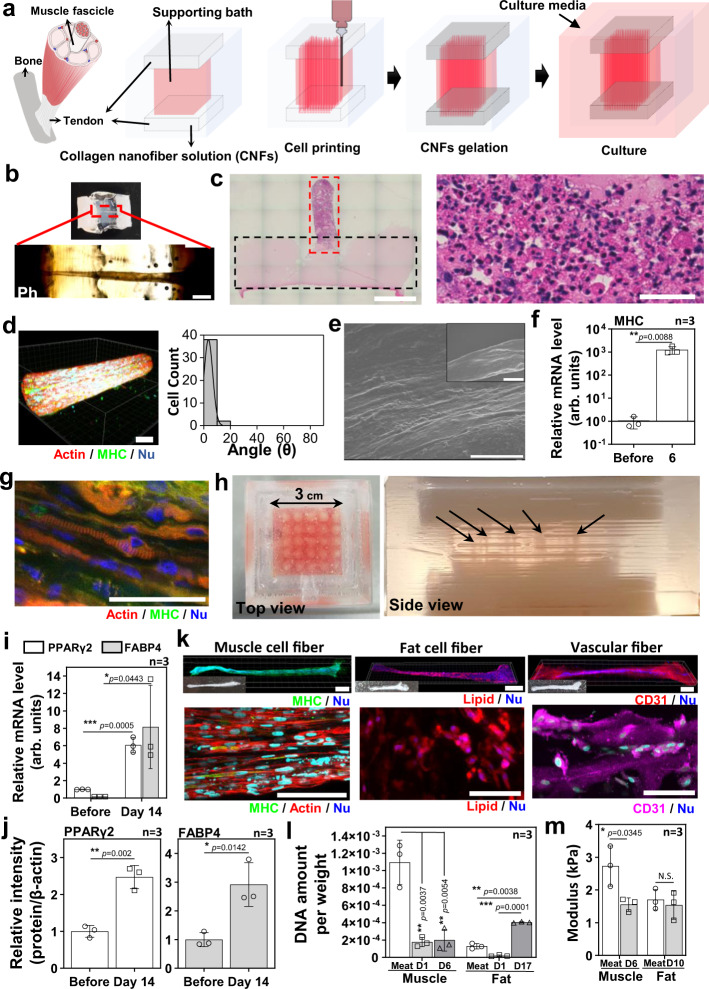
Fig. 4. Tendon-gel integrated bioprinting (TIP) for muscle, fat, and vascular tissue fabrication.
a The schematic of TIP for cell printing. b Optical (upper) and phase-contrast (lower) images of the bSC tissue printed by TIP, keeping the fibrous structure on day 3. The images were taken after fixation. Scale bar, 1 mm. c The H&E-stained image of half of collagen gel (dotted black line)—fibrous bSC tissue (dotted red line) and a magnified image of the fibrous bSC tissue (right). Scale bars, 2 mm (left) and 50 µm (right). d 3D fluorescence image (left) and cell alignment measurement (right) of the TIP-derived bSC tissue stained with actin (red), MHC (green), and nucleus (blue) on day 3 of differentiation. Scale bar, 50 µm. e SEM images of TIP-derived bSC tissue on day 3 of differentiation. Scale bars, 10 µm and 100 µm (inset). f MHC mRNA expression levels of bSCs before printing and TIP-derived bSC tissue on day 3 of differentiation (n = 3 independent samples, pairwise t-test comparison). g Fluorescence image of TIP-derived bSCs tissue stained with actin (red), MHC (green), and nucleus (blue) on day 14 of differentiation. Scale bar, 50 µm. h The optical images of multiple tissue fabrication (25 ea.) by multiple printing. Black arrows indicate printed cell fibers. i, j mRNA levels (i) and protein expression levels (j) of TIP-derived fat tissues before printing and at day 14 of differentiation (at day 17 of total culture) (n = 3 independent samples, pairwise t-test comparison). k Whole fluorescence (left), optical (inset), and magnified (right) images of muscle (on day 4 of differentiation, green: MHC & blue: nucleus), fat (on day 14 of differentiation, red: lipid and blue: nucleus), and vascular (on day 7, magenta: CD31 and blue: nucleus) tissues fabricated by TIP. Scale bars, 1 mm (left) and 100 µm (right). l, m DNA amount per weight (light-gray bars: day 1, and dark-gray bars: day 6 in muscle fiber and day 17 in fat fiber) and (l) compressive modulus (m) of muscle and fat fibers in the commercial meat (white bar) and TIP-derived (gray bars). The modulus of the muscle fiber on day 3 of differentiation (after 6 days) and the fat fiber on day 7 of differentiation (after 10 days) was measured (n = 3 independent samples, paired one-way ANOVA with a Tukey’s HSD post test (l) and pairwise t-test comparison (m)). *p<0.05, **p<0.01, ***p<0.001; error bars represent mean ± s.d. Representative images from at least two independent experiments are shown. Source data are provided as a Source Data file.

