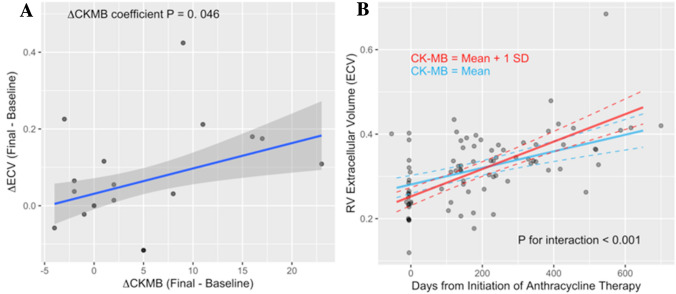
Figure 3.
Changes of RV ECV and their association with CK-MB. (A): the change of ECV in the RV between the baseline MRI study and the final CMR (ΔECV) in each patient correlated with the change of CK-MB (ΔCK-MB) a serum biomarker of myocardial injury. (B) RV ECV increased approximately linearly with time from anthracycline therapy. The rate of RV ECV expansion over time after anthracycline therapy (P < 0.001 for follow-up-time coefficient estimate) increased in proportion to the serum level of CK-MB activity (P < 0.001 for interaction of follow-up time with log-transformed CK-MB level). The longitudinal change of RV ECV was modeled with a linear mixed effects model that included follow-up time (days), log-transformed CK-MB and an interaction term as predictors. The blue and red lines show the predictions from this model for two levels of CK-MB corresponding to the overall mean (blue) of CK-MB and a one standard deviation higher level (red), respectively.

