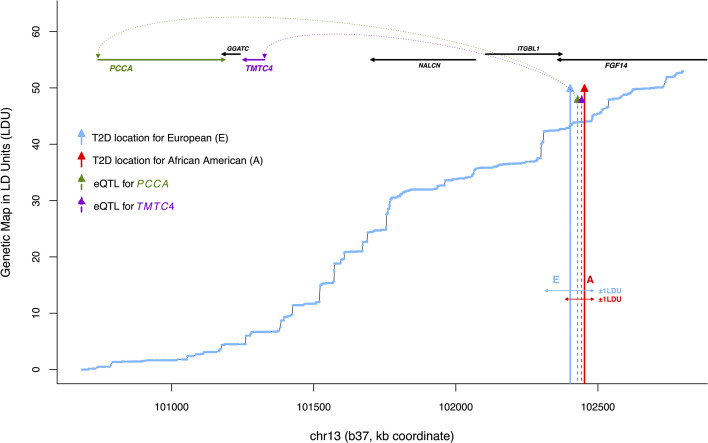
Figure 2.
An example of co-locating T2D and eQTL locations, or ‘T2D-eQTL’ (chr13). Plotted is physical distance (kb coordinate) against genetic distance in linkage disequilibrium units (LDU), based on a European genetic map constructed by Lau et al. (3). The blue line shows cumulative LDU across the region in a ‘step’ and ‘block’ structure, corresponding to regions of LD breakdown and extended LD, respectively. Blue and red arrows correspond to ŜT2D location estimates associated with T2D in the Wellcome Trust European and African American populations (WTC and AA), respectively, with horizontal arrows illustrating the asymmetrical physical distance extending ±1 LDU. The dotted arrows show ŜeQTL location estimates for two cis-genes, PCCA which is a nuclear-encoded mitochondrial gene (NEMG) and TMTC4, which is not (confidence intervals not shown). All ŜT2D and ŜeQTL location estimates are provided in Table 1.

