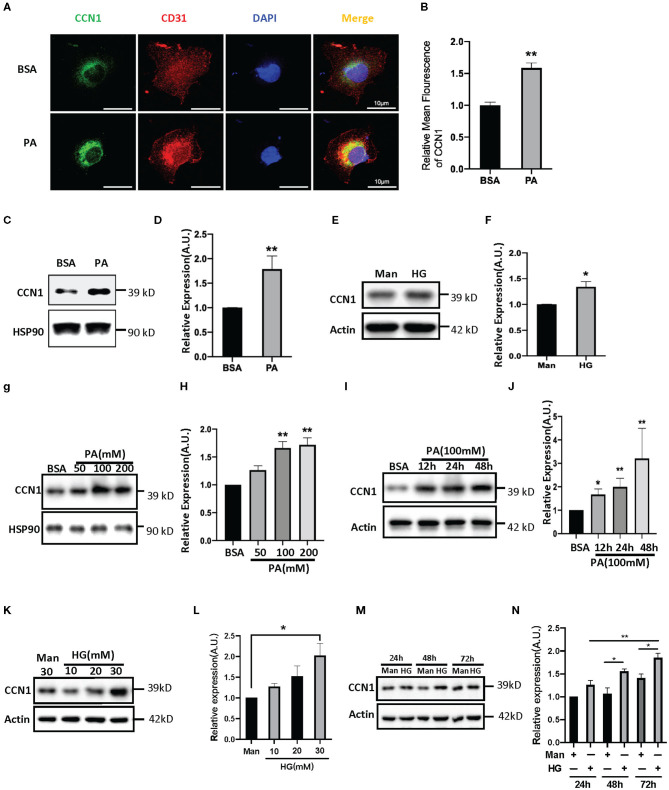
Figure 3.
Palmitic acid (PA) and high glucose (HG) levels induce CCN1expression in human retinal vascular endothelial cells (HRVECs). (A) Representative images and (B) quantification of CCN1 mean fluorescence in HRVECs treated with 100 mM PA for 24 h, scale bar = 10 μm. (C,E) Western blot analysis and (D,F) densitometry quantification of CCN1 in HRVECs under 100 mM PA or 30 mM HG treatment, respectively. (G) Western blot analysis and (H) densitometry quantification of CCN1 in HRVECs under 50, 100, or 200 mM PA for 24 h. (I) Western blot analysis and (J) densitometry quantification of CCN1 in HRVECs under 100 mM PA treatment for 12, 24, and 48 h. (K) Western blot analysis and (L) densitometry quantification of CCN1 in HRVECs under 10, 20, or 30 mM HG for 48 h. (M) Western blot analysis and (N) densitometry quantification of CCN1 in HRVECs under 30 mM HG treatment for 24, 48, and 72 h. *p < 0.05, **p < 0.01.

