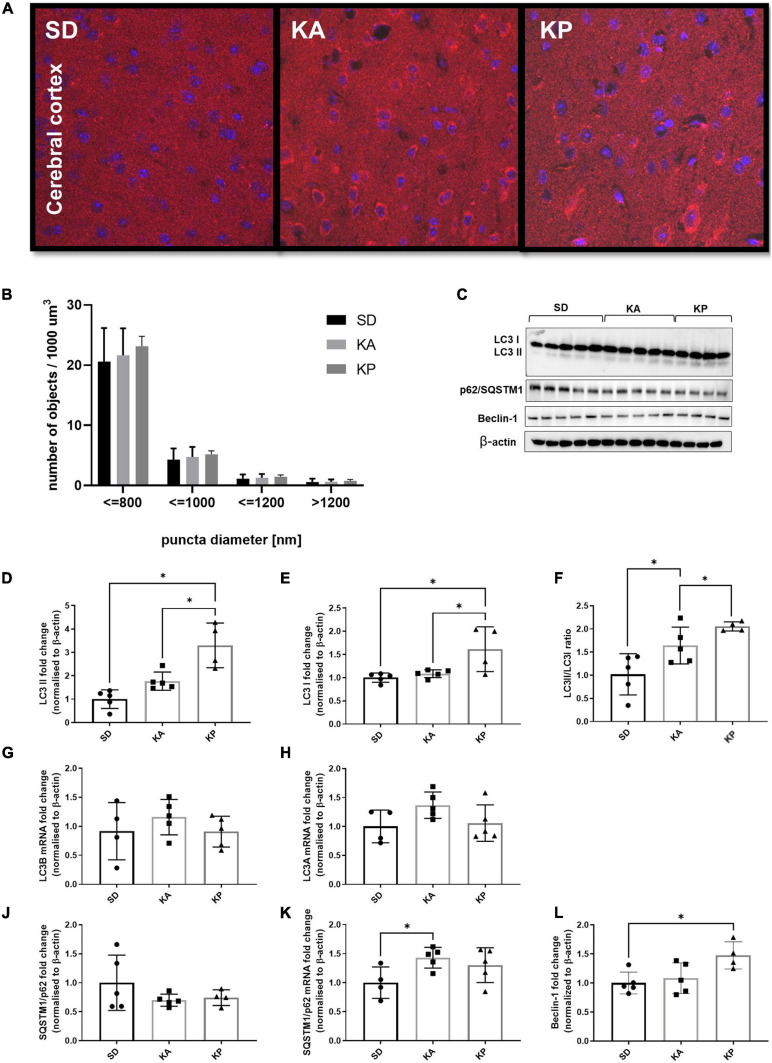
FIGURE 2.
The level of autophagy markers in the cerebral cortex of the mice fed with the ketogenic diets. (A) The cortices were immunolabeled against LC3 protein (red) and the level of LC3-positive puncta was counted (n = 5). The nuclei are shown in blue (DAPI). (B) Number of LC3 puncta per 1 μm^3 of tissue; the counted objects were divided into four categories based on their diameter. (C) LC3, SQSTM1/p62, and Beclin-1 with matched β-actin blots. Quantification of (D) LC3-II, (E) LC3-I protein levels and (F) its ratio. (G) Quantification of LC3 A and (H) LC3 B mRNA levels. (J) Quantification of SQSTM1/p62 and (K) its mRNA level. (L) Quantification of Beclin-1 level. The data is presented as a mean ± standard deviation, ∗ indicates statistically significant changes (p < 0.05). SD marks a group of control animals fed with standard chow, while experimental mice were maintained on the ketogenic diet composed of fat of animal (KA) or plant (KP) origins.

