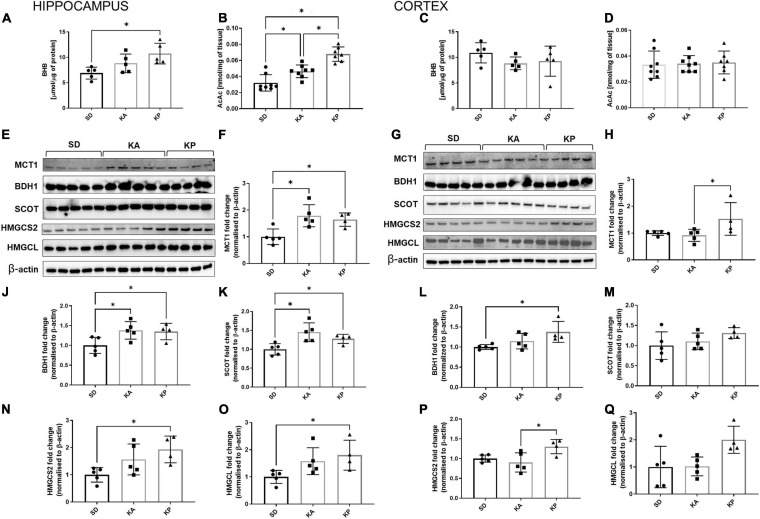
FIGURE 3.
The hippocampal and cortical levels of ketone bodies and enzymes involved in ketone turnover in the cells. The level of hippocampal (A,B, n = 5) and cortical (C,D, n = 5) β-hydroksybutyrate (BHB) and acetoacetate levels (AcAc). MCT1, BDH1, SCOT, HMGCS2, and HMGCL matched β-actin blots performed in the hippocampus (E) and cortex (G). Quantification of MCT1 levels in the hippocampus (F) and cortex (H). Quantification of BDH1 levels in the hippocampus (J) and cortex (L). Quantification of SCOT levels in the hippocampus (K) and cortex (M). Quantification of HMGCS2 level in the hippocampus (N) and cortex (P). Quantification of HMGCL level in the hippocampus (O) and cortex (Q). The data is presented as a mean ± standard deviation, ∗ indicates statistically significant changes (p < 0.05). SD marks a group of control animals fed with standard chow, while experimental mice were maintained on the ketogenic diet composed of fat of animal (KA) or plant (KP) origins.

