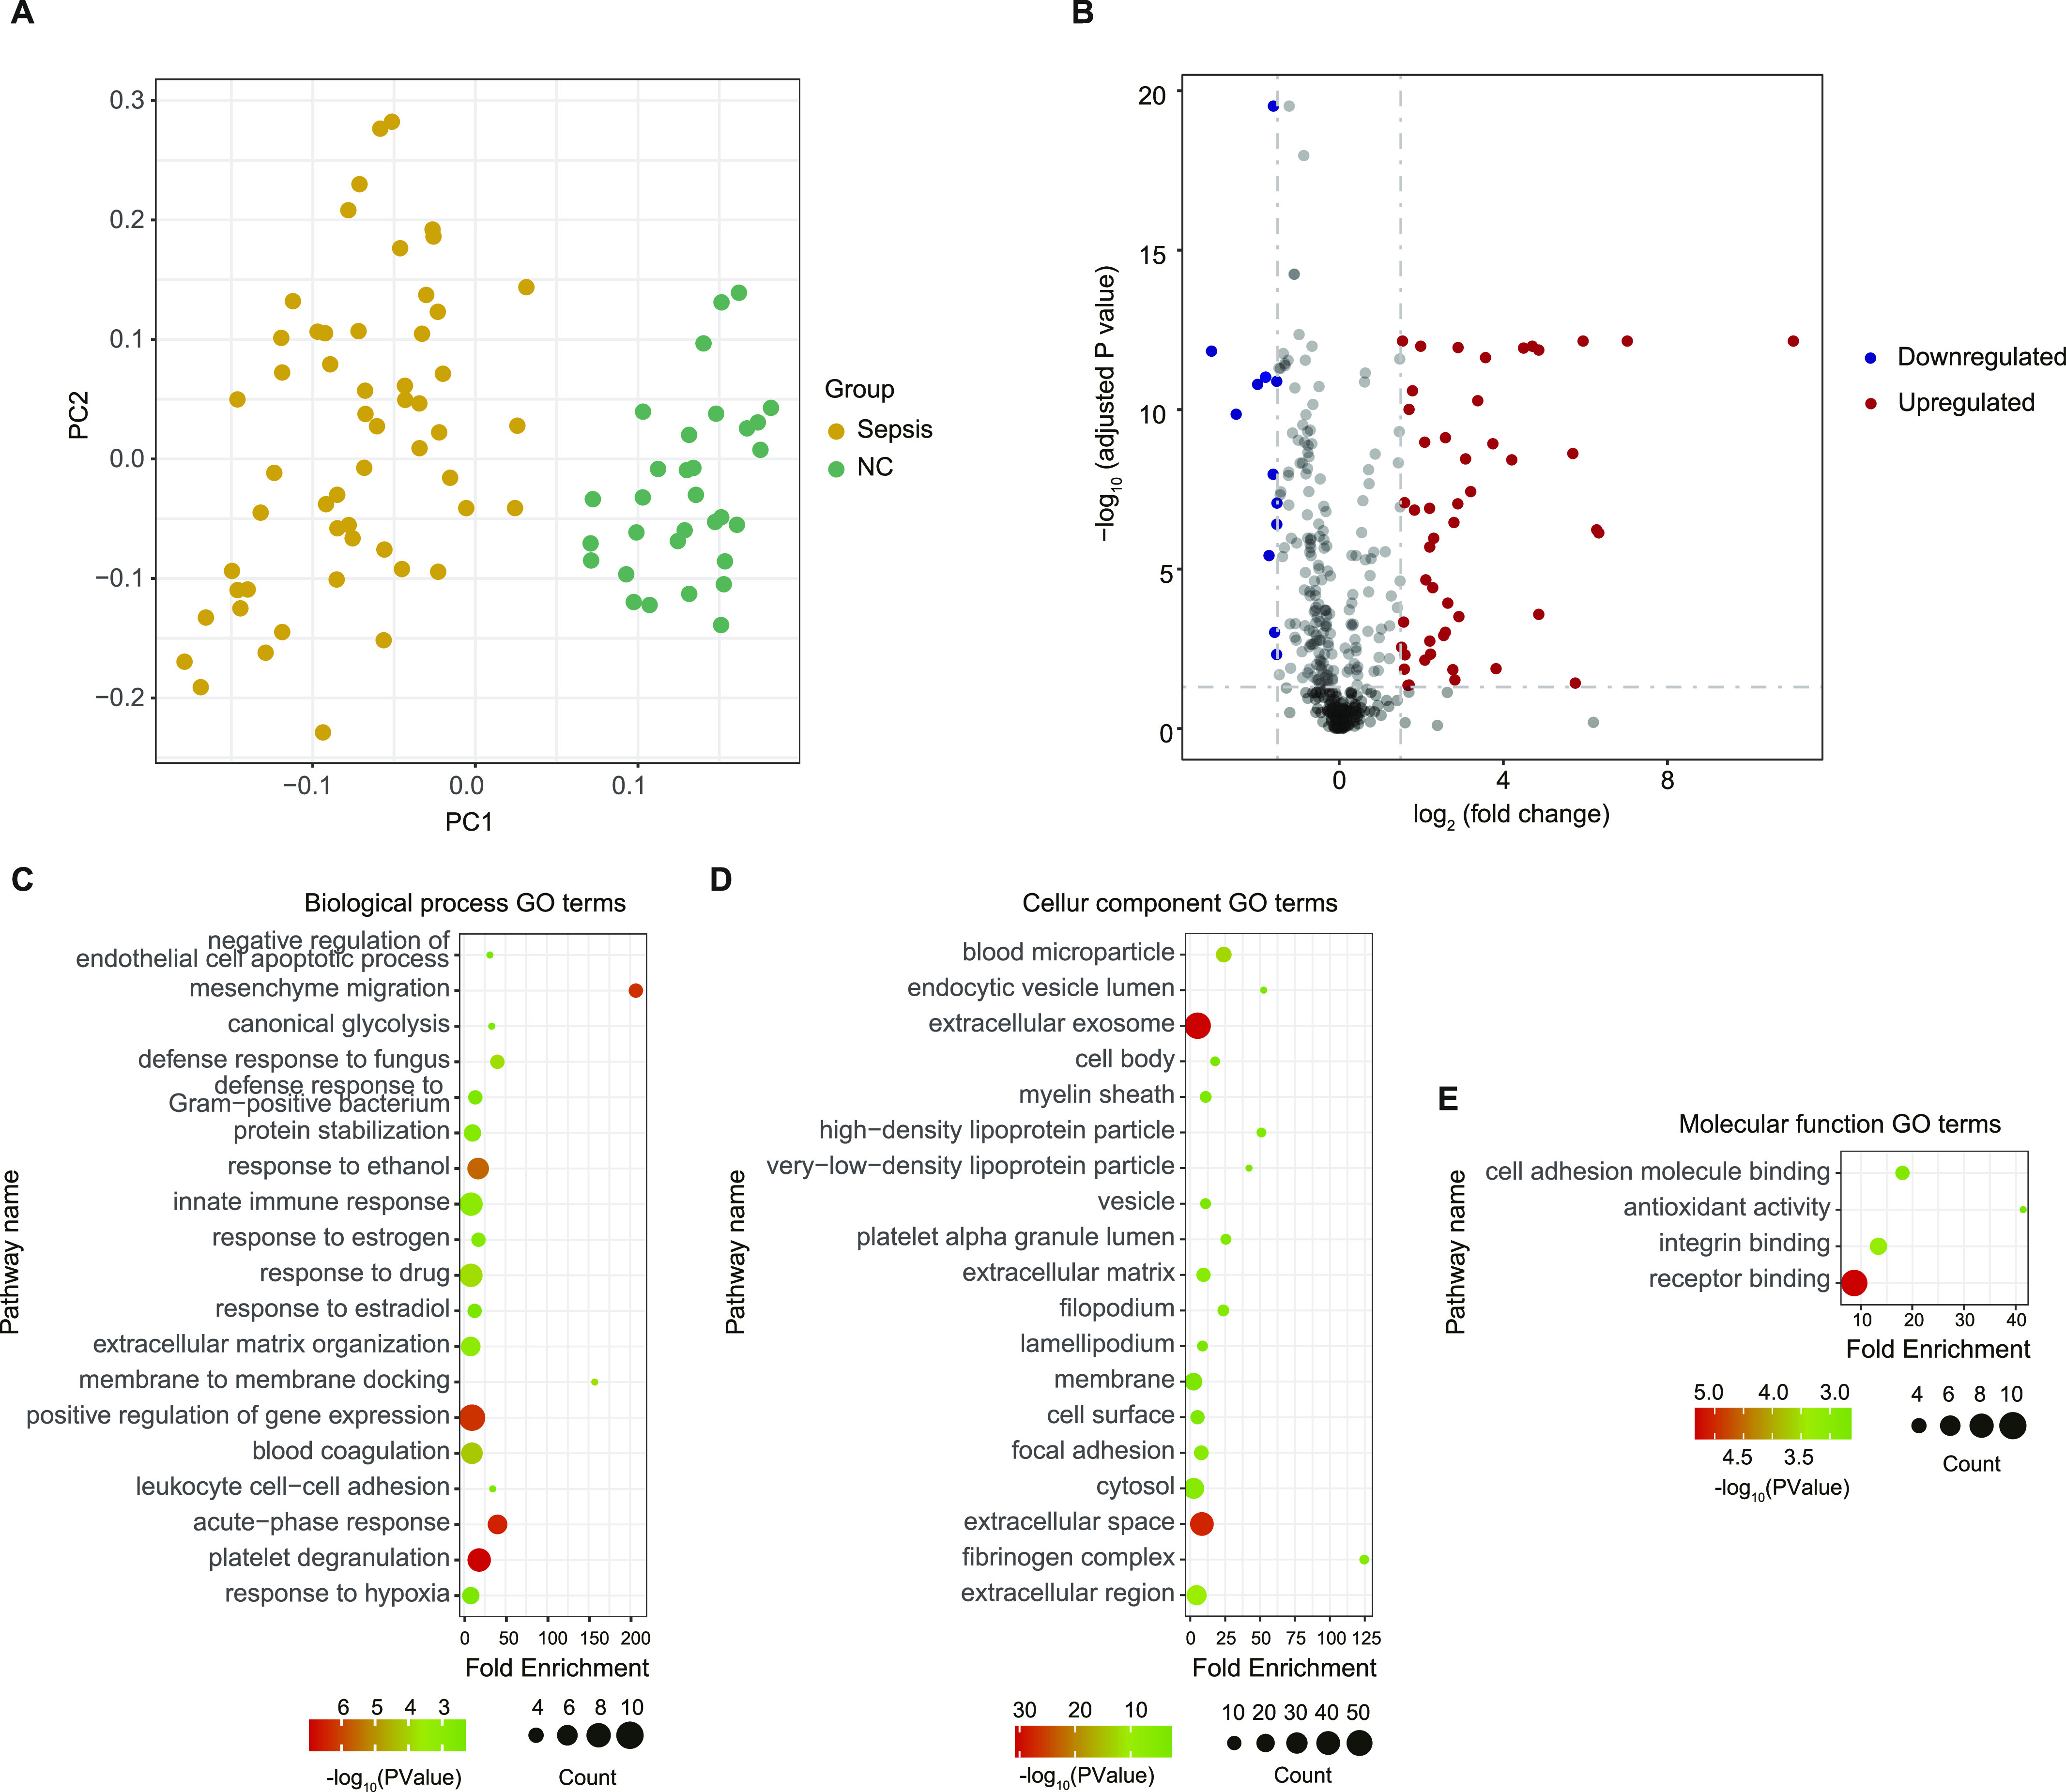
Figure 2. Proteomic landscape of serum from patients with sepsis and healthy controls.

(A) Principal component analysis showing clear separation between patients with sepsis and healthy controls. (B) Volcano plot of differentially expressed proteins, with up- and down-regulated expression coloured red and blue respectively. (C, D, E) Summary of functional annotation for sepsis by gene ontology biological processes (C), cellular components (D), and molecular functions (E) related to the differentially expressed proteins.
