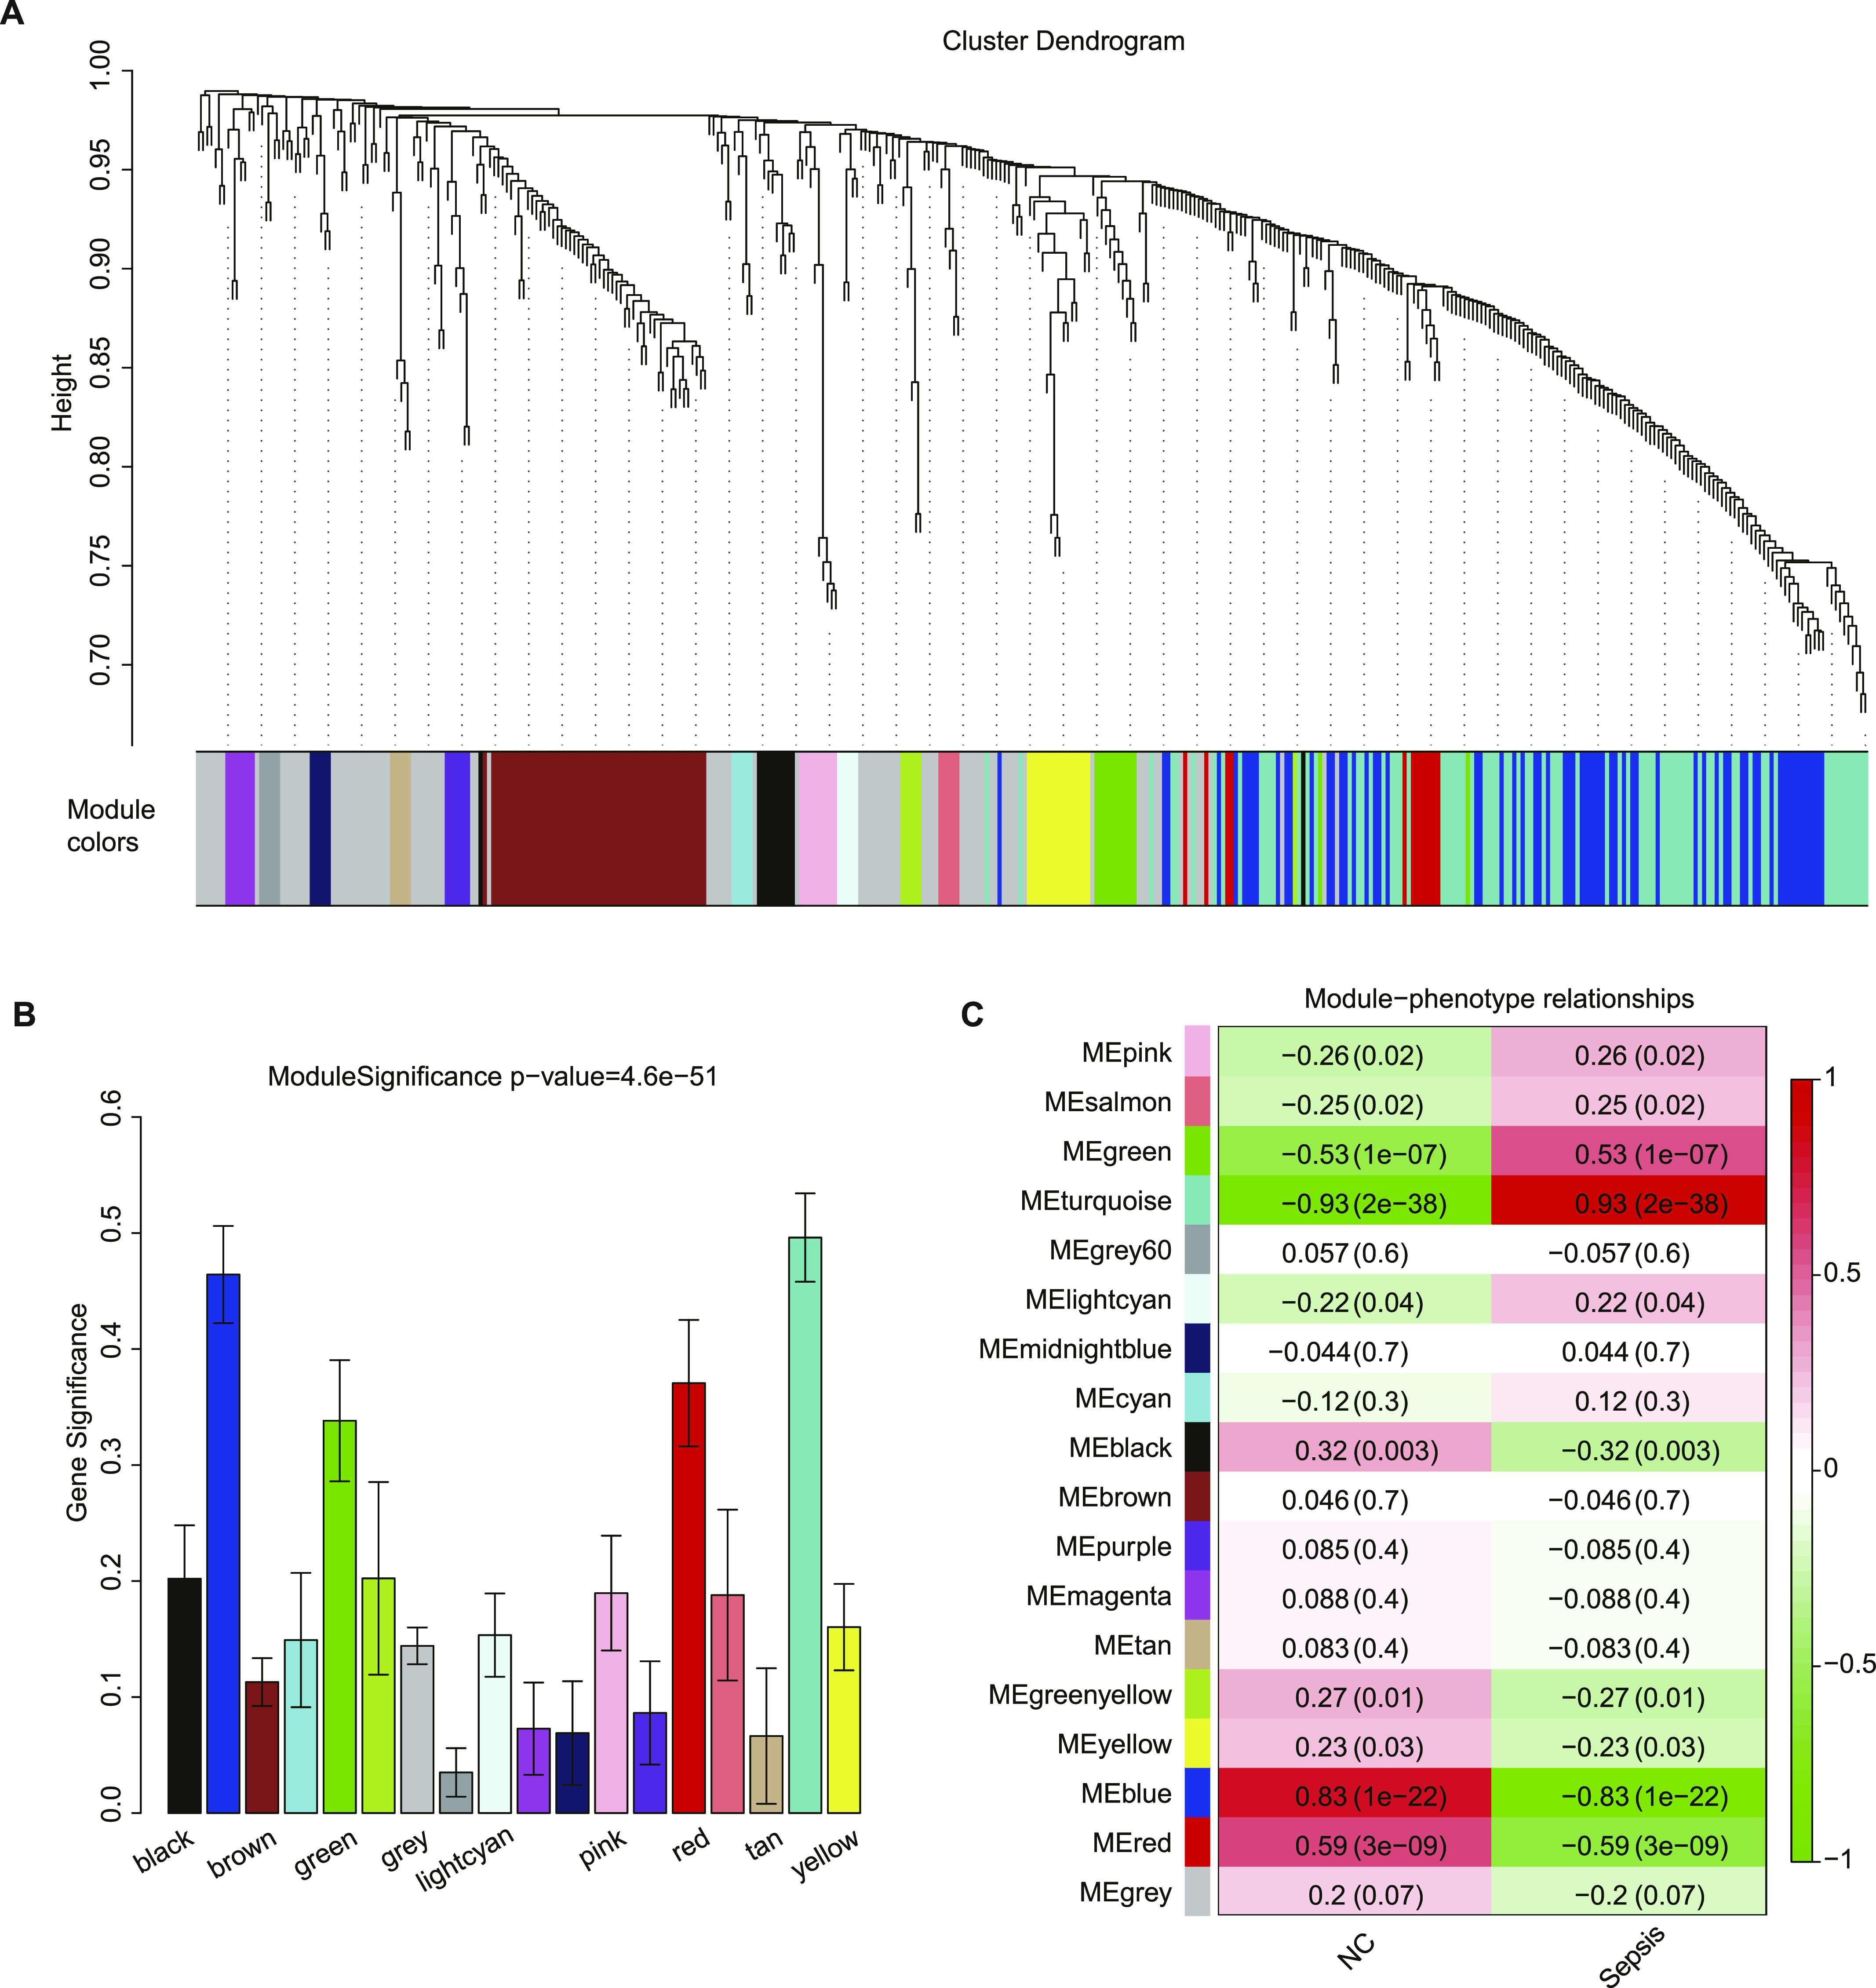
Figure 3. Module detection and protein co-expression network construction using weighted gene co-expression network analysis.

(A) Cluster dendrogram and 18 distinct protein co-expression modules defined by dendrogram branch cutting of all proteins of patients with sepsis and healthy controls. (B) Bar plot of the significance of each module associated with sepsis. (C) Heat map representation of Pearson’s correlation between module eigenproteins and different phenotypes.
